AAAAA SSSSS TTTTTTT RRRRRR OOOOO L OOOOO GGGGG
A A S S T R R O O L O O G G
A A S T R R O O L O O G
AAAAAAA SSSSS T RRRRRR O O L O O G GGGG
A A S T R R O O L O O G G
A A S S T R R O O L O O G G
A A SSSSS T R R OOOOO LLLLLLL OOOOO GGGGG
** VERSION 6.40 **
Documentation for Astrolog version 6.40 (July 2018):
This file contains a complete list of all the features available in Astrolog, and documentation on how to use each option. The file is divided into eight sections:
1) Summary: A summary of the program and a list of its features.
2) Command Switch List: A summary of all the main features which are accessed via command line switches and parameters is listed, along with the single key press commands that can be given to a windowed command line version of the program (such as the X Windows version) to change the display in various ways.
3) Command Switch Description: The list of command switches and keys is repeated, but after each option is given a full description of the details of the feature.
4) Text Display: Descriptions of things that appear in Astrolog text displays are described. This consists of describing how to enter chart information into the program, and how to interpret what is seen in the standard main display.
5) Files: Details of default settings, in compile time options and in the default configuration file, are described, along with using Astrolog files in general.
6) Graphics: Next is a description of the different graphic chart displays and how they are organized, for versions such as MS Windows and X Windows. (Looking for a quick display to prove Astrolog was worth downloading and/or compiling? With graphics try: “astrolog -Xn -XG”!)
7) Windows Version: Then is discussed Astrolog for MS Windows, and a description of the menu and dialog interface it offers.
8) Compiling: Finally is a section on compiling Astrolog if you have the source code files, as opposed to an executable ready to run, as well as how to compile and run Astrolog on the Macintosh.
Astrolog 6.40 is a many featured and customizable astrology chart calculation program for Windows, Unix, Macinosh, and other platforms. It is 100% freeware and requires no registration fee. :) The complete source code is available. Astrolog features: wheels, aspects, midpoints, relationship charts, transits, progressions, some interpretations, astro-graphy, local horizon, constellations, planet orbits, dispositors, various influence charts, esoteric astrology, biorhythms, different zodiacs, central planets, 21 house systems, 3D houses, 10800 year ephemeris, asteroids, Uranians, fixed stars, Arabic parts, script files and macros, interactive MS/X11 Windows graphics, smooth animation of charts, graphic files in PostScript, Windows metafile, and bitmap formats, and more!
Astrolog is relatively unique in astrology software for the following reasons:
(1) It’s 100% freeware. :)
(2) It runs on multiple platforms, such as Windows, Mac, and Unix.
(3) The full source code is available.
(4) Features are accessible from the command line and from shell scripts.
(5) It offers many features not found in most other programs.
“The Best Freeware/Shareware Program of 1995 is
Astrolog for Windows”
- American Astrology, March 1996
“One exceptionally good freeware program is
available to astrologers - good enough to be worthy of review with the main
commercial programs. This is Astrolog...”
- The Mountain Astrologer, November 1995
“For a free program to have such a superb
ephemeris with an 8000-year range is incredible.”
- American Astrology, November 1994
--
A list of the main features in Astrolog:
Position calculation features:
Positions of Sun through Pluto and the house cusps.
Positions of Chiron and the four main asteroids.
Positions of True and Mean nodes, Part of Fortune, Vertex, and East Point.
Position of Lilith (the “Dark Moon”).
Position of Vulcan
Positions of the eight Uranian planets.
Positions of 47 fixed stars (named).
Positions of 1122 fixed stars (unnamed).
Positions of 177 Arabic parts and their formulas.
Option to use any or all of accurate 10800 year ephemeris.
Computation features:
21 house systems.
Tropical and sidereal zodiacs.
Specify zodiac starting position / ayanamsa.
Heliocentric and other planet centered charts.
Applying and separating aspects.
Parallel and contraparallel aspects.
Harmonic charts.
Solar charts with objects on Ascendant or Midheaven.
Decan positions.
Dwad and nested dwad positions.
Navamsa positions.
Esoteric astrology and Rays.
3D houses that take planetary latitude into account.
3D aspects that take planetary latitude into account.
Positions relative to ecliptic or equator.
Local horizon positions in prime vertical coordinates.
Barycentric charts.
Specify your own positions for planets.
Display formats:
Generic position listing.
Wheel charts.
Hindu or Vedic format wheel charts.
Aspect and midpoint grids.
List aspect configurations such as Yods.
List aspects sorted by influence.
List midpoints sorted by position.
Local horizon positions.
Times of planets rising and setting.
Solar system orbit charts.
Gauquelin sector charts.
Astro-graph charts.
List latitude crossings in astro-graph charts.
Generic monthly and yearly calendars.
Ephemeris tables.
Transit graphs.
Chart spheres.
Biorhythm charts.
Transit and progression features:
Secondary progressions and solar arc progressions.
Specify your own progression rate.
Times of exact aspects among transiting planets.
Times of planets changing sign or direction.
Times of lunar phases and season changes.
Times of exact aspects in a progressed chart.
Times of exact transit events.
Times of transits to house cusps.
Times of solar, lunar, and other returns.
Times of exact transits from progressed planets.
List transits to natal planets within orb in influence order.
List aspects within orb among transiting planets in influence order.
Transits to composite and other no-time charts.
Relationship chart features:
Synastry charts.
Composite charts.
Time space midpoint charts.
Weighted relationship charts.
Display elapsed time between charts.
Aspect and midpoint grids between two charts.
Aspect and midpoint lists between two charts.
Automatic progressed to natal comparison chart.
Interpretation features:
Influence charts sorting planets and signs by power.
Interpret natal positions and natal aspects.
Interpret transits and midpoints.
Interpret transiting aspects and sign and direction changes.
Interpret aspects and midpoints between charts.
Interpret synastry charts.
Graphics features:
Graphic wheel chart.
Graphic bi-wheel comparison / transit chart.
Graphic tri-wheels and quad-wheels.
Graphic aspect / midpoint and relationship aspect / midpoint grids.
Graphic astro-graph chart on a map of the world.
Graphic local horizon, polar horizon, Gauquelin wheel, and orbit charts.
Graphic ephemeris tracking chart.
Graphic esoteric astrology Ray table.
Graphic calendars and biorhythms.
Dispositor graph chart.
Plot positions among the astronomical constellations.
Smoothly animate charts through time at varying rates.
Continuously update chart to current moment now.
Animate a rotating globe.
Timed exposures for horizon and orbit charts.
Create PostScript graphic files.
Create graphic X11 and Windows bitmap files.
Create Windows metafiles.
Create Daedalus 3D wireframe files.
Customization options:
Initialization file for default settings.
Choose what transiting and natal planets to include in charts.
Choose among 18 major and minor aspects, or define your own.
Specify aspect orbs.
Specify the maximum orb allowed to a planet.
Specify wider orbs for any planet.
Display zodiac positions to the nearest second.
DMY & MDY date formats and 24 hour & am/pm time formats.
Display locations in hours & minutes or 360 degree form.
Customize interpretation strings.
Customize colors.
Redefine planets to various hypothetical planets.
Redefine planets to point to external ephemeris files.
Define your own orbital elements for planets.
Choose among graphic glyphs for certain signs and planets.
Specify influence of planets and planets when transiting.
Specify influence of houses and aspects.
Chart access features:
Quick charts for the current moment now.
Save and load chart time and place to file.
Save and load chart positions to file.
Save text output directly to file.
Relocate charts.
Cast a chart a specified time ahead of any chart.
System features:
Display text charts in Ansi color.
Export text charts in HTML format.
Paging for when text charts are more than a screenful.
Access environment variables.
Define macros for your most common operations.
Easy to use menu and dialog interface in the Windows version.
Astrolog (version 6.40) command switches:
-H: Display this help list.
-Hc: Display program credits and copyrights.
-HC: Display names of zodiac signs and houses.
-HO: Display available planets and other celestial objects.
-HA: Display available aspects, their angles, and present orbs.
-HF: Display names of astronomical constellations.
-HS: Display information about planets in the solar system.
-H7: Display information about the seven esoteric Rays.
-HI: Display meanings of signs, houses, planets, and aspects.
-He: Display all tables together (-Hc-H-Y-HX-HC-HO-HA-HF-HS-H7-HI).
-Q: Prompt for more command switches after display finished.
-Q0: Like -Q but prompt for additional switches on startup.
-M <1-48>: Run the specified command switch macro.
-M0 <1-48> <string>: Define the specified command switch macro.
-M[1-4][0] <strings>: Define macro(s) to run when chart calculated.
-Y: Display help list of less commonly used command switches.
Switches which determine the type of chart to display:
-v: Display list of object positions (chosen by default).
-v0: Like -v but express velocities relative to average speed.
-w [<rows>]: Display chart in a graphic house wheel format.
-w0 [..]: Like -w but reverse order of objects in houses 4..9.
-g: Display aspect and midpoint grid among planets.
-g0: Like -g but flag aspect configurations (e.g. Yod's) too.
-gm: For comparison charts, show midpoints instead of aspects.
-ga: Like -g but indicate applying instead of difference orbs.
-gp: Like -g but generate parallel and contraparallel aspects.
-a: Display list of all aspects ordered by influence.
-a0: Like -a but display aspect summary too.
-aa: Like -a but indicate applying and separating orbs.
-ap: Like -a but do parallel and contraparallel aspects.
-a[jonOACm]: Sort by power, orb, diff, planet, aspect, pos, midpoint.
-m: Display all object midpoints in sorted zodiac order.
-m0: Like -m but display midpoint summary too.
-ma: Like -m but show aspects from midpoints to planets as well.
-Z: Display planet locations with respect to the local horizon.
-Z0: Like -Z but express coordinates relative to polar center.
-Zd: Search day for object local rising and setting times.
-S: Display x,y,z coordinate positions of planets in space.
-l: Display Gauquelin sectors for each planet in chart.
-l0: Like -l but approximate sectors using Placidus cusps.
-j: Display astrological influences of each object in chart.
-j0: Like -j but include influences of each zodiac sign as well.
-7: Display esoteric astrology and ray summary for chart.
-L [<step>]: Display astro-graph locations of planetary angles.
-L0 [..]: Like -L but display list of latitude crossings too.
-K: Display a calendar for given month.
-Ky: Like -K but display a calendar for the entire year.
-d [<step>]: Print all aspects and changes occurring in a day.
-dm: Like -d but print all aspects for the entire month.
-dy: Like -d but print all aspects for the entire year.
-dY <years>: Like -d but search within a number of years.
-dp <month> <year>: Print aspects within progressed chart.
-dpy <year>: Like -dp but search for aspects within entire year.
-dpY <year> <years>: Like -dp but search within number of years.
-dp[y]n: Search for progressed aspects in current month/year.
-B: Like -d but graph all aspects occurring in a day.
-B[m,y,Y]: Like -B but for entire month, year, or five years.
-B0: Like -B but don't restrict fast moving objects from graph.
-D: Like -d but display aspects by influence instead of time.
-E: Display planetary ephemeris for given month.
-Ey: Display planetary ephemeris for the entire year.
-EY <years>: Display planetary ephemeris for a number of years.
-E[]0 <step>: Display ephemeris times for days, months, or years.
-e: Print all charts together (i.e. -v-w-g0-a-m-Z-S-l-j0-7-L0-K-d-D-B-E).
-t <month> <year>: Compute all transits to natal planets in month.
-tp <month> <year>: Compute progressions to natal in month for chart.
-tr <month> <year>: Compute all returns in month for chart.
-t[p]y: <year>: Compute transits/progressions for entire year.
-t[p]Y: <year> <years>: Compute transits for a number of years.
-t[py]n: Compute transits to natal planets for current time now.
-T <month> <day> <year>: Display transits ordered by influence.
-Tt <month> <day> <year> <time>: Like -T but specify time too.
-T[t]p <month> <day> <year>: Print progressions instead of transits.
-T[p]n: Display transits ordered by influence for current date.
-V [..]: Like -t but graph all transits occurring during period.
-V[d,y,Y] [[<day>] <month>] <year>: Like -V for day, year, or 5 years.
-V[..]0: Like -V but don't restrict fast moving objects from graph.
-P [<parts>]: Display list of Arabic parts and their positions.
-P0 [<parts>]: Like -P but display formulas with terms reversed.
-P[z,n,f]: Order parts by position, name, or formula.
-I [<columns>]: Print interpretation of selected charts.
Switches which affect how the chart parameters are obtained:
-n: Compute chart for this exact moment using current time.
-n[d,m,y]: Compute chart for start of current day, month, year.
-z [<zone>]: Change the default time zone (for -d-E-t-q options).
-z0 [<offset>]: Change the default Daylight time setting.
-zl <long> <lat>: Change the default longitude & latitude.
-zv <elev>: Change the default elevation above sea level.
-zj <name> <place>: Change the default name and place strings.
-zt <time>: Set only the time of current chart.
-zd <date>: Set only the day of current chart.
-zm <month>: Set only the month of current chart.
-zy <year>: Set only the year of current chart.
-zi <name> <place>: Set name and place strings of current chart.
-q <month> <date> <year> <time>: Compute chart with defaults.
-qd <month> <date> <year>: Compute chart for noon on date.
-qm <month> <year>: Compute chart for first of month.
-qy <year>: Compute chart for first day of year.
-qa <month> <date> <year> <time> <zone> <long> <lat>: Compute chart automatically given specified data.
-qb <month> <date> <year> <time> <daylight> <zone> <long> <lat>: Like -qa but takes additional parameter for Daylight offset.
-qj <day>: Compute chart for time of specified Julian day.
-i <file>: Compute chart based on info in file.
-i[2,3,4] <file>: Load chart info into chart slots 2, 3, or 4.
-o <file> [..]: Write parameters of current chart to file.
-o0 <file> [..]: Like -o but output planet/house positions.
-os <file>, > <file>: Redirect output of text charts to file.
Switches which affect what information is used in a chart:
-R [<obj1> [<obj2> ..]]: Restrict specific bodies from displays.
-R0 [<obj1> ..]: Like -R but restrict everything first.
-R1 [<obj1> ..]: Like -R0 but unrestrict and show all objects.
-R[C,u,U]: Restrict all minor cusps, all Uranians, or stars.
-RT[0,1,C,u,U] [..]: Restrict transiting planets in -t lists.
-RA [<asp1> ..]: Restrict specific aspects from displays.
-RO <obj>: Require object to be present in aspects.
-C: Include angular and non-angular house cusps in charts.
-u: Include transneptunian/Uranian bodies in charts.
-U: Include locations of fixed background stars in charts.
-U[z,l,n,b]: Order by azimuth, altitude, name, or brightness.
-A <0-18>: Specify the number of aspects to use in charts.
-A3: Aspects calculated by latitude combined with zodiac position.
-Ap: Orb limits apply to latitude as well as zodiac position.
-Ao <aspect> <orb>: Specify maximum orb for an aspect.
-Am <planet> <orb>: Specify maximum orb allowed to a planet.
-Ad <planet> <orb>: Specify orb addition given to a planet.
-Aa <aspect> <angle>: Change the actual angle of an aspect.
Switches which affect how a chart is computed:
-b: Use ephemeris files for more accurate location computations.
-b0: Display locations and times to the nearest second.
-bs: Use less accurate Moshier formulas instead of Swiss Ephemeris.
-bp: Use less accurate Placalc files instead of Swiss Ephemeris.
-ba: Don't use Placalc ephemeris for the four main asteroids.
-bm: Use inaccurate Matrix formulas when ephemeris unavailable.
-bU: Use inaccurate Matrix formulas for fixed stars only.
-c <value>: Select a different system of house division. 0 = Placidus, 1 = Koch, 2 = Equal, 3 = Campanus, 4 = Meridian, 5 = Regiomontanus, 6 = Porphyry, 7 = Morinus, 8 = Topocentric, 9 = Alcabitius, 10 = Krusinski, 11 = Equal MC, 12 = Pullen S-Ratio, 13 = Pullen S-Delta, 14 = Whole, 15 = Vedic, 16 = Sripati, 17 = Horizon, 18 = APC, 19 = Carter Poli Equatorial, 20 = Null.
-c3: Place in houses using latitude as well as zodiac position.
-s [..]: Compute a sidereal instead of standard tropical chart.
-sr: Compute right ascension locations relative to equator.
-s[z,h,d]: Display locations as in zodiac, hours/minutes, or degrees.
-h [<objnum>]: Compute positions centered on specified object.
-p <month> <day> <year>: Cast 2ndary progressed chart for date.
-p0 <month> <day> <year>: Cast solar arc chart for date.
-p[0]t <month> <day> <year> <time>: Like -p but specify time too.
-p[0]n: Cast progressed chart based on current date now.
-pd <days>: Set no. of days to progress / day (default 365.24219).
-x <value>: Cast harmonic chart based on specified factor.
-1 [<objnum>]: Cast chart with specified object on Ascendant.
-2 [<objnum>]: Cast chart with specified object on Midheaven.
-3: Display objects in their zodiac decan positions.
-4 [<nest>]: Display objects in their (nested) dwad positions.
-f: Display houses as sign positions (flip them).
-G: Compute houses based on geographic location only.
-J: Display wheel charts in Vedic format.
-9: Display objects in their zodiac navamsa positions.
-F <objnum> <sign> <deg>: Force object's position to be value.
-Fm <objnum> <obj1> <obj2>: Force object's position to midpoint.
-+ [<days>]: Cast chart for specified no. of days in the future.
-- [<days>]: Cast chart for specified no. of days in the past.
-+[m,y] [<value>]: Cast chart for no. of months/years in future.
Switches for relationship and comparison charts:
-r <file1> <file2>: Compute a relationship synastry chart.
-rc <file1> <file2>: Compute a composite chart.
-rm <file1> <file2>: Compute a time space midpoint chart.
-r[c,m]0 <file1> <file2> <ratio1> <ratio2>: Weighted chart.
-rd <file1> <file2>: Print time span between files' dates.
-rb <file1> <file2>: Display biorhythm for file1 at time file2.
-r0 <file1> <file2>: Keep the charts separate in comparison.
-rp[0] <file1> <file2>: Like -r0 but do file1 progr. to file2.
-rt <file1> <file2>: Like -r0 but treat file2 as transiting.
-r[3,4]: Make graphics wheel chart tri-wheel or quad-wheel.
-y <file>: Display current house transits for particular chart.
-y[b,d,p,t] <file>: Like -r0 but compare to current time now.
Switches to access graphics options:
-k: Display text charts using Ansi characters and color.
-k0: Like -k but only use special characters, not Ansi color.
-kh: Text charts saved to file use HTML instead of Ansi codes.
-X: Create a graphics chart instead of displaying it as text.
-Xb: Create bitmap file instead of putting graphics on screen.
-Xb[n,c,v,a,b]: Set bitmap file output mode to X11 normal, compacted, very compact, Ascii (bmtoa), or Windows bmp.
-Xp: Create PostScript vector graphic instead of bitmap file.
-Xp0: Like -Xp but create complete instead of encapsulated file.
-XM[0]: Create Windows metafile vector graphic instead of bitmap.
-X3: Create Daedalus wireframe vector file instead of bitmap.
-Xo <file>: Write output bitmap or graphic to specified file.
-XB: Display X chart on root instead of in a separate window.
-Xm: Create monochrome graphic instead of one in color.
-Xr: Create chart graphic in reversed colors (white background).
-Xw <hor> [<ver>], -ge[..]: Change the size of chart graphic.
-Xs <100,200,300,400>: Change the size of map or characters by %.
-XS <100,200,300,400>: Change size of graphics chart text by %.
-XQ: Ensure square charts remain so regardless of bitmap size.
-Xi: Create chart graphic in slightly modified form.
-Xt: Inhibit display of chart info at bottom of graphic.
-Xu: Inhibit display of a border around graphic.
-Xl: Inhibit labeling of object points in chart graphic.
-Xj: Don't clear screen between chart updates, drawing trails.
-Xe: Draw Earth's equator in certain charts.
-XU: Draw all stars from sefstars.txt file in certain charts.
-XC: Draw house boundaries or alternate info in certain charts.
-X1 <object>: Rotate wheel charts so object is at left edge.
-X2 <object>: Rotate wheel charts so object is at top edge.
-XX[0] [<degrees> [<degrees>]]: Display chart sphere instead of wheel.
-Xd <name>, -di[..] <name>: Open X window on specified display.
-XW: Simply display an image of the world map.
-XW0: Like -XW but do a non-rectangular Mollewide projection.
-XG[0] [<degrees> [<degrees>]]: Display image of world as a globe.
-XP[0] [<degrees>]: Like -XG but create globe from polar projection.
-XF: Display maps as constellations on the celestial sphere.
-Xn [<mode>]: Start up chart or globe display in animation mode.
-XN: Map animates chart time instead of rotating map itself.
-XM[2-4][0] <strings>: Define macro(s) to run when chart drawn.
-HX: Display list of key press options for screen graphics.
-W <value>: Run given Windows menu command internally.
-WN <1-32000>: Set animation update delay in milliseconds.
-WM <1-48> <text>: Set Windows menu text for macro command.
-Wn: Don't redraw screen until user forces update.
-Wo: Continually autosave graphics screen to bitmap file.
-Wo0: Continually autosave graphics screen to numbered files.
-Wo3: Autosave graphics screen to wireframe instead of bitmap.
-WSg: Setup Windows program group, for current user only.
-WSG: Setup Windows program group, for all users.
-WSd: Setup Windows desktop icon for program.
-WSx: Setup registering Windows file extensions for program.
-WSu: Unregister Windows file extensions for program.
--
Astrolog (version 6.40) obscure command switches:
-Y: Display this help list.
-YT: Compute true positions in space instead of apparent in sky.
-YV: Compute topocentric positions instead of from center of body.
-Yh: Compute location of solar system barycenter instead of Sun.
-Yn: Compute location of true instead of mean node.
-Yd: Display dates in D/M/Y instead of M/D/Y format.
-Yt: Display times in 24 hour instead of am/pm format.
-Yv: Display distance in metric instead of imperial units.
-Yr: Round positions to nearest unit instead of crop fraction.
-YC: Automatically ignore insignificant house cusp aspects.
-YO: Automatically adjust settings when exporting and printing.
-Y8: Clip text charts at the rightmost (e.g. 80th) column.
-YQ <rows>: Pause text scrolling after a page full has printed.
-Yq[0-9] <strings>: Define command lines to run and show in sequence.
-Yo: Output chart info and position files in old style format.
-Yc: Angular cusp objects are house positions instead of angles.
-Yp: Fix polar houses by preserving Ascendant instead of MC.
-Yz <min>: Forward clock by amount for current moment charts.
-Y1[0] <obj1> <obj2>: Rotate planets so one is at other's position.
-Yl <1-36>: Toggle plus zone status of sector for sector chart.
-YP <-1,0,1>: Set how Arabic parts are computed for night charts.
-Yb <days>: Set number of days to span for biorhythm chart.
-Ye <obj> <index>: Change orbit of Uranian to seorbel.txt object.
-Yeb <obj> <index>: Change orbit of Uranian to external ephemeris.
-YeO <obj1> <obj2>: Change orbit of Uranian to internal planet.
-Ye[..]n <obj> <index>: Change Uranian to North Node of object.
-Ye[..]s <obj> <index>: Change Uranian to South Node of object.
-Ye[..]a <obj> <index>: Change Uranian to apihelion of object.
-Ye[..]p <obj> <index>: Change Uranian to perihelion of object.
-Ye[..]HSBNTV <obj> <index>: Toggle heliocentric, sidereal zodiac, barycentric, true node, true position, or topocentric for object.
-YE <obj> <semi-major axis> <eccentricity (3)> <inclination (3)> <perihelion (3)> <ascending node (3)> <time offset (3)>: Change orbit of object to be the given elements.
-YU <obj> <name>: Change position of star to sefstars.txt entry.
-YR <obj1> <obj2> <flag1>..<flag2>: Set restrictions for object range.
-YRT <obj1> <obj2> <flag1>..<flag2>: Transit restrictions for range.
-YR0 <flag1> <flag2>: Set restrictions for sign, direction changes.
-YRZ <rise> <zenith> <set> <nadir>: Set restrictions for -Zd chart.
-YR7 <ruler> <exalt> <eso> <hier> <ray>: Set rulership restrictions.
-YRd <div>: Set divisions within signs to search for degree changes.
-YAo <asp1> <asp2> <orb1>..<orb2>: Set aspect orbs for range.
-YAm <obj1> <obj2> <orb1>..<orb2>: Set max planet orbs for range.
-YAd <obj1> <obj2> <orb1>..<orb2>: Set planet orb additions for range.
-YAa <asp1> <asp2> <ang1>..<ang2>: Set planet aspect angles for range.
-YAD <asp> <name> <abbrev> <glyph>: Customize display names of aspect.
-Yj <obj1> <obj2> <inf1>..<inf2>: Set influences for object range.
-YjC <cusp1> <cusp2> <inf1>..<inf2>: Set influences for house cusps.
-YjA <asp1> <asp2> <inf1>..<inf2>: Set influences for aspect range.
-YjT <obj1> <obj2> <inf1>..<inf2>: Set transit influences for range.
-Yj0 <inf1> <inf2> <inf3> <inf4>: Set influences given to planets in ruling sign, exalted sign, ruling house, exalted house.
-Yj7 <inf1> <inf2> <inf3> <inf4> <inf5> <inf6>: Set influences for in esoteric, hierarchical, Ray ruling sign, plus same for ruling house.
-YJ <obj> <sign> <cosign>: Set sign planet rules and co-rules.
-YJ0 <obj> <sign>: Set zodiac sign given planet exalts in.
-YJ7 <obj> <sign> <cosign>: Set signs planet esoterically rules.
-YJ70 <obj> <sign> <cosign>: Set signs planet hierarchically rules.
-Y7O <obj1> <obj2> <ray1>..<ray2>: Customize object rays.
-Y7C <sign1> <sign2> <rays1>..<rays2>: Customize sign rays.
-YI <obj> <string>: Customize interpretation for object.
-YIa <sign> <string>: Customize interpretation adjective for sign.
-YIv <sign> <string>: Customize interpretation verb for sign.
-YIC <house> <string>: Customize interpretation for house.
-YIA <asp> <string>: Customize interpretation for aspect.
-YIA0 <asp> <string>: Customize aspect interpretation statement.
-YkO <obj1> <obj2> <col1>..<col2>: Customize planet colors.
-YkC <fir> <ear> <air> <wat>: Customize element colors.
-YkA <asp1> <asp2> <col1>..<col2>: Customize aspect colors.
-Yk7 <1..7> <1..7> <col1>..<col2>: Customize Ray colors.
-Yk0 <1..7> <1..7> <col1>..<col2>: Customize 'rainbow' colors.
-Yk <0..8> <0..8> <col1>..<col2>: Customize 'general' colors.
-YD <obj> <name>: Customize display name of object.
-YXG <0-2><0-2><0-3><0-2>: Select among different graphic glyphs for Capricorn, Uranus, Pluto, and Lilith.
-YXD <obj> <string1> <string2>: Customize glyphs for planet.
-YXA <asp> <string1> <string2>: Customize glyphs for aspect.
-YXv <type> [<size> [<lines>]]: Set wheel chart decoration.
-YXg <cells>: Set number of cells for graphic aspect grid.
-YXS <au>: Set radius of graphic solar system orbit chart.
-YXj <num>: Set number of graphic orbit trails to remember.
-YXj0 <step>: Set vertical step rate for graphic orbit trails.
-YX7 <inf>: Set influence width for graphic esoteric ephemeris.
-YXk: Use more color for sign boundaries in graphics charts.
-YXk0: Use more color for house boundaries in graphics charts too.
-YXf <val>: Set usage of actual system fonts in graphic file.
-YXp <-1,0,1>: Set paper orientation for PostScript files.
-YXp0 <hor> <ver>: Set paper size for PostScript files.
-YB: Make a beep sound at the time this switch is processed.
-0[o,i,q,X]: Disallow file output, input, exiting, and graphics.
-;: Ignore rest of command line and treat it as a comment.
--
Astrolog graphics screen key press options (version 6.40):
Press 'H' or '?' to display this list of key options.
Press 'p' to toggle pause status on or off.
Press 'x' to toggle fg/bg colors on screen.
Press 'm' to toggle color/monochrome display on screen.
Press 'i' to toggle status of the minor chart modification.
Press 't' to toggle header info on current chart on screen.
Press 'b' to toggle drawing of a border around the chart.
Press 'l' to toggle labeling of object points in chart.
Press 'j' to toggle not clearing screen between chart updates.
Press 'v' to display current chart positions on text screen.
Press 'R', 'C', 'u', 'U' to toggle restriction status of minor objects, minor house cusps, Uranian planets, and stars.
Press 'c' to toggle relationship comparison chart mode.
Press 's', 'h', 'a', 'f', 'g', 'z', 'y' to toggle status of sidereal zodiac, heliocentric charts, 3D houses, domal charts, decan charts, vedic format wheel charts, and navamsa charts.
Press 'O' and 'o' to recall/store a previous chart from memory.
Press 'B' to dump current window contents to root background.
Press 'B' to resize chart display to full size of screen.
Press 'Q' to resize chart display to a square.
Press '<' and '>' to decrease/increase the scale size of the glyphs and the size of world map.
Press '[' and ']' to decrease/increase tilt in globe display.
Press '+' and '-' to add/subtract a day from current chart.
Press 'n' to set chart information to current time now.
Press 'N' to toggle animation status on or off. Charts will be updated to current status and globe will rotate.
Press '!'-'(' to begin updating current chart by adding times. !: seconds, @: minutes, #: hours, $: days, %: months, ^: years, &: years*10, *: years*100, (: years*1000.
Press 'r' to reverse direction of time-lapse or animation.
Press '1'-'9' to set rate of animation to 'n' degrees, etc.
Press '1'-'9' to determine section of chart to show if clipped.
Press 'V','A','Z','S','M','K','J','L','E','X','W','G','P' to switch to normal (-v), grid (-g), local (-Z), space (-S), sector (-l), calendar (-K), dispositor (-j), astro-graph (-L), ephemeris (-E), sphere (-XX), world map (-XW), globe (-XG), polar (-XP) modes.
Press 'Y' to switch to biorhythm relationship chart mode.
Press '0' to toggle between -Z,-Z0 & -XW,-XW0 & -E,-Ey modes.
Press 'F' to toggle between world and constellation map modes.
Press 'F1'..'F12' [plus Shift,Ctrl,Alt] to run macros 1..48.
Press 'space' to force redraw of current graphics display.
Press 'del' to clear the graphics screen and not redraw.
Press 'tab' to toggle between graphics resolutions.
Press 'enter' to input a command line of general switches.
Press 'q' to terminate graphics and the program.
Left mouse button: Draw line strokes on chart in window.
Middle mouse button: Print coordinates of pointer on world map.
Right mouse button: Terminate the window and program.
Astrolog allows command line switches to be invoked with either the leading dash (“-”) standard to Unix users, or a leading slash (“/”) that PC users are more accustomed to. Not only that, but the leading character is actually optional. For example, the command “astrolog -i chartfile -R -u -U -Z -Xs 300 -Xi -XB” can be done as “astrolog /i chartfile /r /u /U /Z /Xs 300”, or can be abbreviated as just “astrolog i chartfile R u U Z Xs 300 Xi XB”. (This is subject to a couple of minor limitations, in that one can't have the -1 or -3 option follow a -R restriction list of numbers, since the “-1” will be parsed as a number.)
Many switches in their standard form are technically a “toggle” instead of a “set” for the particular feature in question. For example, “astrolog -v -g -g” will only result in the -v chart being printed. An aspect grid won't, because the first -g turned it on while the second -g turned it off again. This can be useful, in say the -e everything switch. If you want all of Astrolog’s charts except the astro-graph, you can do “astrolog -e -L”, where the -e turns everything on and the -L turns the astro-graph chart (already on because of -e) back off. In another example, to get a chart with only the fixed stars in it, one can do “astrolog -R0 -RU”, where the -R0 restricts everything, and the -RU unrestricts all the stars. The various -X switches which set a mode in graphics are also toggles. A combination like “-Xr -Xr” which with one instance will just go into reverse video mode, will remain out of it because the first -Xr put you in and the second toggled you back out.
Command switch flags may actually be forced on or off regardless of their current setting with special character prefixes. Many switches (such as -s) represent on/off flags and their setting is toggled when the switch is encountered. However, that alone doesn't allow one to force the setting to be a value, because we don't know if it needs to be toggled or not. Therefore, prefixing any flag switch with '_' will reset its state even if already off, while prefixing with '=' will always make it on. For example, putting “_s” on a command line will always set tropical zodiac, while “=s” will always set sidereal. The standard '-' and '/' prefixes, along with no prefix at all, always toggle the current setting. This is useful for configuration files where we want to set various flags to particular values. There’s one more obscure switch prefix of ':', which doesn't affect the setting at all, but still affects any subsetting parameters. For example, “:I 80” won't affect the interpretation setting at all, but will still set the default screen width to 80 columns. That is slightly simpler than the “-I 80 -I” double toggle hack that would have to be done to do such a thing otherwise.
The various static help listings that may be generated, such as the lists from -H, -HO, -HI, and so on, may be combined with each other and even the actual charts. For convenience the program will terminate right away and not prompt for chart info if the only thing specified is one of the tables, e.g. just “-H” will print the help list and exit, but “-H -i file -g” will print the help list followed by an aspect grid chart.
In the command list below, greater than/less than symbols ('<' and '>') are used to denote a command switch parameter to be replaced by the appropriate value, brackets ('[' and ']') are used to denote an optional parameter, and commas are used to separate either/or choices. For example, the specification of the -I switch is “-I [<columns>]”, meaning that one can specify the -I switch, followed a parameter for the number of screen columns, but that this extra parameter is optional. The specification of the -Xs switch is “-Xs <100,200,300,400>“, meaning it can be used as either “-Xs 100”, “-Xs 200”, “-Xs 300”, or “-Xs 400”. An ellipsis ('..') generally refers to a variable length list of values or an abbreviation for something already indicated in related switches.
Correct parsing of strings is done on the command line (and in files since they are technically command lines) in addition to when the user is being prompted for data within the program. For example, to do the natal chart for the alt.astrology newsgroup using the -qa switch, one may enter the intuitive “-qa Jul 29 1991ad 6:23pm -10 151e13 33s52”. The items may be entered in simpler numeric forms as well, such as just “-qa 7 29 1991 18:23 -10 -151:13 -33:52”.
Any command switch that takes an index number as a parameter may have it specified by its actual name instead of a harder to remember value. For example, the switch sequence “-c 1 -R 6 -A 5 -F 7 10 0” may also be entered as the more understandable “-c Koch -R Jupiter -A Sextile -F Saturn Capricorn 0”. Any string may be abbreviated to its first three characters, or any longer substring as long as they all match. Some stars (along with Vulcan and Vulkanus) have the same first three characters, so they need longer substrings to be unambiguous. Aspects should be based on their formal abbreviations, e.g. “ssx” instead of “sem” for Semisextile.
Astrolog (version 6.40) command switches:
-H: Display this help list.
This option displays a list exactly like the one given above on the screen. Note: Concerning the list itself, PC users are accustomed to seeing command switches with a leading slash “/” instead of a dash “-”. To accommodate this, this list of options available does, if the program has been compiled for a PC, display all the switches with a leading “/” instead of a “-”. (On Unix and other systems they will be displayed with the standard leading “-”.)
-Hc: Display program credits and copyrights.
This help switch displays a full page of credits, listing the names of those who programmed Astrolog or parts of it, and important copyright information and other legal items. Every time the command line version of the program is invoked, the -Hc switch is mentioned to use to see this info.
-HC: Display names of zodiac signs and houses.
The -HC switch will display a list of the 12 signs of the zodiac, and the 12 houses, listing their standard and traditional names. This is similar to switches like -HO or -HA below, in that it displays lists of things (objects, aspects, or in this case the signs) that Astrolog uses in its charts. This switch will also include esoteric astrology information, in that for each sign, listed will be the Rays associated with the sign, the sign’s standard exoteric planetary rulers, the sign’s esoteric rulers, the sign’s Hierarchical rulers, the planet exalted in the sign, the exoteric detriments in the sign, and the planet that falls in the sign.
-HO: Display available planets and other celestial objects.
Similar to the -HA option below, the -HO option will list the planets and other celestial objects used by the program, and their index numbers as recognized by the -R switch restrictions. This list will also show the zodiac signs that planets rule, have their detriment in, are exalted in, and have their fall i.e. are debilitated in. Stars are printed in the list along with their azimuth, altitude, and brightness values. Note that this list shows only those items that aren't restricted when it’s displayed. If you want to show all 90 objects regardless of restriction status, then use the -R1 switch to activate them all and combine it with -HO. This switch will also include esoteric astrology information, in that for each planet, listed will be the signs the planet esoterically rules, the signs the planet Hierarchically rules, and the Ray associated with the planet.
Concerning objects the program includes, Astrolog supports the position of Earth in the same way it does other planets. Earth is object number 0, placed before all other objects. Earth is restricted by default, which means that in heliocentric charts, Earth needs to be unrestricted to see it. If Earth is unrestricted in a geocentric chart, it will be the heliocentric position of the Earth (i.e. directly opposite the Sun). Similar logic will be applied whenever the central object is unrestricted (with an unrestricted Sun in a heliocentric chart being the geocentric position of the Earth, i.e. opposite the Earth).
Astrolog can do the position of Lilith, often called the “Dark Moon”. This Lilith is the point in space of one focus of the Moon’s elliptical orbit around the Earth (Earth itself being in the other of the two), and not the asteroid or hypothetical planet by the same name. Lilith is object number 18 in Astrolog, and in graphics charts its glyph is a small circle with a forward slash through it. If preferred, one can use the -YXG glyph selection switch (described later) to choose the “European” version of the glyph which is like the glyph for the Moon but smaller and flipped horizontally. The -b ephemeris files switch setting needs to be in effect to get Lilith’s positions.
Astrolog can do the position of the East Point as well, which is technically the same as the position of the Ascendant at the equator for whatever time. This is object number 21 in Astrolog, and its graphics glyph is a simple “EP” abbreviation.
-HA: Display available aspects, their angles, and present orbs.
The -HA command switch gives a list of all 18 supported aspects, their abbreviations as used in the aspect grids, their angles, and their orbs. It will list the number of each aspect in addition to all the other info (e.g. conjunct = 1, opposition = 2, etc.) so one can see what number to pass to the -A switch when changing the number of aspects used. Finally, it will print a brief description of what each aspect glyph looks like. This is useful if one doesn't know what aspects the various symbols in the graphic displays are referring to. If the parallel aspects mode is active, then this will instead list the parallel aspects, namely parallel and contraparallel.
-HF: Display names of astronomical constellations.
This will display a text table of all the constellations, listing their traditional names, their astronomical abbreviations as used in the graphics above, their English meanings, and even their genitive or possessive form (e.g. “Lyra” is the name of the constellation, but the star Vega in it is called Alpha “Lyrae”).
-HS: Display information about planets in the solar system.
This is a another static table which will display some astronomical information about the planets (and Earth’s Moon) in a simple form. For each planet is shown its distance from the Sun (or Earth) in Astronomical Units (AU), its orbital period in Earth years, its diameter relative to the Earth (Earth being 1), its rotational period (i.e. day) in hours, its mass relative to the Earth (Earth being 1), its average density with respect to water (water being 1), the tilt of its axis with respect to its orbit, and finally the number of primary moons or satellites it has. This table also includes Chiron and the four asteroids, the lunar nodes, and the Uranians, at least for the distance from Sun and length of year fields (and diameter field for the asteroids).
-H7: Display information about the seven esoteric Rays.
Information about the seven Rays used in esoteric astrology is available with this switch. Each Ray is listed, along with its name in esotericism, and the aspect of will that Ray covers. The signs associated with each Ray will be printed (by default each Ray is associated with exactly three signs), and the planets associated with each Ray. Finally is printed the “slice” value of the Ray, which is the count of signs associated with that Ray, each proportioned by the number of other Rays associated with that sign. For example, Ray 5 is associated with Leo (along with Ray 1), Sagittarius (along with Rays 4 and 6), and Aquarius (only Ray 5). Therefore Ray 5’s slice value is 1/2 + 1/3 + 1/1 = 1.83.
-HI: Display meanings of signs, houses, planets, and aspects.
This will display the general meanings of each sign, each house, each planet, and each aspect, on the screen. This shows more or less the database the program uses to base its interpretations on (see the -I switch setting for charts later).
-He: Display all tables together (-Hc-H-Y-HX-HC-HO-HA-HF-HS-H7-HI).
This switch will print out all 11 of Astrolog’s static table help listings, similar to what -e does for actual charts. Specifically, this will show the -Hc copyright screen, the -H switch list, the -Y obscure switch list, the -HX graphics key press list, the -HC sign and house list, the -HO object list, the -HA aspect list, the -HF constellation list, the -HS planet information list, the -H7 esoteric Ray list, and the -HI core interpretation list, for over 600 lines of informational output.
-Q: Prompt for more command switches after display finished.
Usually when Astrolog finishes printing the specified chart or charts, or when we leave a graphics screen mode, the program will terminate. However, sometimes one wants to display or work with lots of charts or options, which would normally cause them to have to invoke the program over and over again from their shell, using many processes, and can be slow loading over and over from a slow disk. Auto-termination is also bad when automatically starting up the program in an X window or DOS box - once the program finishes, the container will exit right away too, not allowing reading of the text charts. The -Q switch causes the program to enter a looping mode environment where (after the first chart is displayed) the user will automatically be prompted to enter a new set of command switches (using the no SWITCHES interface described later) which will be processed. This will go on and the program will run until you enter “.” on a line for the switches to really terminate it.
Program errors which normally cause Astrolog to exit right away, will (unless “fatal” errors) return the user back to this outer loop. What’s more is that being in the loop doesn't cause all the minor program variables to be reset every time. The main things like what info to use and what charts to display must be specified each time, but minor modes (such as the present -x harmonic factor) won't, so say specify -x 5 once, and you will be casting fifth harmonic charts until you specify otherwise or exit the loop, not having to include -x each time.
-Q0: Like -Q but prompt for additional switches on startup.
This is just like -Q above except that the user will first be prompted for command switches right upon entering the program. Note that these will be in addition to whatever else was on the command line where the -Q0 itself was specified. This is mostly useful when running on a Windows system (see later) where one can have -Q0 as a default switch to pass to the program. Upon activation, the user will be in a loop with Astrolog asking for switches right away before proceeding to generate or prompt for any chart information.
-M <1-48>: Run the specified command
switch macro.
-M0 <1-48> <string>: Define the specified
command switch macro.
Astrolog has a feature to run “switch macros”, or a whole command line with one small switch. The -M switch takes one parameter, which is the number of the macro to run. When encountered, the switches it represents will be processed. This is similar to loading in a generic command file with -i, except macros are limited to one command line. Macros however don't require separate files, and may even call command files themselves with -i.
The switch -M0 is the option that defines a macro. It takes two parameters: the index of the macro to define, and a string representing the command line to assign to it. (The command string probably needs to be in quotes to ensure it’s treated as one parameter to -M0, instead of many items which will get processed right away.) There are 48 macro slots available to define or run. Macros may do anything and even call or define other macros. It’s possible to get in an infinite loop if you make a macro (or command file) call or load itself, which will make the program terminate with some unusual error.
Macros are powerful and their uses are nearly endless. They can be defined in the astrolog.as config file for your most common switch sequences, and are designed to prevent things such as batch files that would have to be created otherwise. Suppose you often want to see the transits of outer planets only to the house cusps in your natal chart for the current month. The command line for this is “-i yourchart -tn -RT0 6 7 8 9 10 -R0 -RC -C”. You can assign this to the tenth macro slot with: -M0 10 “-i yourchart -tn -RT0 jup sat ura nep plu -R0 -RC -C”. That line can be put in your astrolog.as and you can do this month’s transits by just typing “astrolog -M 10”. Here’s another example: Suppose you want a feature to bring up the chart of the spouse of whoever’s chart you are viewing at any time. You can define a special macro, say in slot 5, in each of your chart info files which does a -i on the file of their spouse, or does nothing if they’re unmarried. Now when in graphics mode, you can press 'F5' anytime and Astrolog will bring up the spouse’s chart! You could define a bunch of macros to set various color sets or aspect orbs and switch among them quickly using the function keys. You could even make a simple chart database by having each chart file load the next one in sequence in some macro, and then cycle through your charts by running that macro in a -Q switch loop or from the graphics screen.
-M[2-4][0] <strings>: Define macro(s) to run when chart calculated.
The -M2, -M3, and -M4 switches allow different calculation settings to be used for different rings in a bi-wheel, tri-wheel, or quad-wheel chart. The switches take 2, 3, or 4 string parameters respectively, and each string is a command line that gets automatically applied before calculating the planet positions for that ring. If the switch is invoked as -M20, -M30, or -M40 with an extra “0”, then it takes one final parameter for a command line to run at the very end, which can restore settings to default values for subsequent use of the program. With this feature you can do things such as have a heliocentric chart and a geocentric chart displayed at the same time. You can even do things such as (assuming all calculation methods are compiled into the program) have one wheel with planets computed via Swiss Ephemeris, another by the old Placalc ephemeris, and a third by the very old Matrix formulas, to compare their accuracy side by side.
-Y: Display help list of less commonly used command switches.
This displays a list of available command switches, like the -H option but showing only “less common” switches that would clutter things up if they were in the main list, and are usually only specified in configuration files. Hence almost all of those switches begin with 'Y'.
Switches which determine the type of chart to display:
-v: Display list of object positions (chosen by default).
This is just a formal specification for the standard chart listing of the planetary positions. One will get this chart by default if they don't specify any other chart types, and they will get it along with everything else in the -e option (see below). Although it isn't necessary, it must be included if one wants this type of chart to be displayed along with some of the other chart types described below.
-v0: Like -v but express velocities relative to average speed.
This switch is like -v except that it modifies planet velocities slightly. The -v switch chart normally expresses velocity values as an absolute quantity in degrees per day that the object appears to have moved through the zodiac. That means outer planets will generally always have lower values, e.g. although a velocity of 0.01 degrees/day for fast moving Mercury means it’s about to turn retrograde, the same velocity value is normal for slow moving Pluto. Because it is useful to know when a planet is about to change direction, the -v0 switch will divide the actual velocity values by how fast each planet moves with respect to the Sun. That means all planets will have an average relative velocity value of 1.0, and in all cases a velocity of 2.0 means the planet is moving twice as fast as normal, and one of 0.01 means the planet is about to turn retrograde.
Note: The -v0 switch which expresses planetary velocities relative to average speed has a known incompatibility will cause some applying vs. separating aspect orbs to be inverted, i.e. displayed as applying when the reverse is actually true or vice versa. This affects aspect grids and aspect lists (-ga, -ma, and -D charts, but not the -T transit influence charts). That is because velocities are used to determine applying vs. separating to see if one planet is overtaking another. The issue comes with the program thinking that, for example, Pluto moving 2 times faster than normal will soon overtake Mars, slightly ahead of it in the zodiac and moving half normal speed. When the values are expressed as absolute speed, it’s apparent that the outer planet Pluto always moves much slower than the more inner planet Mars even when Mars is moving half normal speed. This issue is not likely to come up much since only explicitly combining -v0 with -ga, -ma, or -D will cause a problem.
-w [<rows>]: Display chart in a graphic house wheel format.
Display of the chart in a nice wheel format is supported using the -w switch. (If one of the houses gets too “full” of planets, the planet will be put at the beginning of the next house.) The same chart header information as is at the top of the standard -v chart is printed in the middle of the wheel. Some information in addition to this is shown, which is: (1) the day of the week that the date falls on, (2) the Universal Time (UT) of the time of the chart being cast (like UTC/GMT in the 24 hour clock), (3) the sidereal time for the chart cast, where sidereal time is vaguely similar to UT except 0:00 for it is approximately when 0 Aries crosses the meridian, as opposed to when the Sun crosses the Nadir for UT, (4) whether the zodiac system is set to tropical or sidereal, and whether the planetary positions are geocentric, heliocentric, or centered around some other body, and (5) the Julian day corresponding to the date and time of the chart. This chart will automatically exclude a house object from being listed if its position is the same as the cusp composing the wheel.
Note that this switch takes an optional parameter to specify the size in text rows of each house printed. By default this is four, but one may increase (realize this will make the chart require more than 24 lines to print) or decrease this value to their preference. The parameter may range from 0 to 10, and with this you can nicely generate a text wheel chart with all 89 objects in it, without overflowing all the houses. The number 0 means to automatically size to cover the house with the largest number of objects in it (houses will be printed with at least 4 rows, and won’t autosize until a 5th object is present in a house).
-w0 [..]: Like -w but reverse order of objects in houses 4..9.
In the -w text wheel option, the objects in each house are printed from top to bottom in order from earliest in the house to latest. This looks good except for in houses 5..8 where this would appear backwards (e.g. a planet having just entered the 6th house from the 5th would be displayed right under the Descendant.) Therefore the objects from houses 4 through 9 are reversed and printed in order from bottom to top, making a more flowing looking wheel chart. If however, one always wants each house to be filled from its top to bottom regardless of which house, replace the -w with the -w0 switch
-g: Display aspect and midpoint grid among planets.
Aspects and midpoint display are supported: Invoke as astrolog -g and a rectangular grid showing the midpoint locations for each planet, and showing if any aspects are present and how accurate they are, is displayed. The planets are labeled down the main diagonal of the grid, with the aspects to the lower left and the midpoints in the upper right. This is of course often used along with the -A* switches. Both the aspect orbs and midpoints are displayed to the nearest minute, and on the main diagonal (or edges if a relationship aspect grid) is displayed the sign and degree of the planet in question in addition to the planet name itself.
-g0: Like -g but flag aspect configurations (e.g. Yod’s) too.
Search through the aspect grid for major aspect configurations, including Grand Trines, T-Squares, Grand Crosses, Yod’s, Cradles, and Stelliums, with the -g0 option. In a Stellium, three or four objects must all be conjunct with each other. In a Cradle, four objects form three sextiles producing a chain of sextiles half way around the zodiac. This option will produce the same aspect grid that -g displays, but afterwards it will go through the grid and list any of these aspect configurations and what objects are forming them. Note that for Yods, the Inconjunct aspect must be unrestricted in order to see them (e.g. include -A 6). Note that for Stelliums, three and four planet conjunction Stelliums are listed separately, which means the three redundant three planet Stelliums within each four planet Stellium won’t be shown.
-gm: For comparison charts, show midpoints instead of aspects.
For relationship aspect grids, the -gm switch will display a midpoint grid instead of an aspect grid between the planets in the two charts e.g. “-r0 chart1 chart2 -gm”.
-ga: Like -g but indicate applying instead of difference orbs.
Ability to determine whether an aspect is applying or separating (is about to happen or just happened) is included in the -g option. Normally the aspect orbs are flagged as being '+' or '-' based on whether they are greater or less than the exact amount (e.g. a 91 degree Square has a +1 degree orb while a 89 degree one a -1 orb.) If one, however, invokes the -g option as -ga instead, an orb printed as 'a' will indicate an applying aspect while an orb with 's' a separating one. (To estimate applying vs. separating, the program examines the planetary positions and their relative velocities at the time in question.)
-gp: Like -g but generate parallel and contraparallel aspects.
Astrolog can do parallel and contraparallel aspects. Two planets are parallel when they have the same declination with respect to the equator, and are contraparallel when their declinations are the same amount but on opposite sides of the equatorial plane. The -gp switch will turn on the aspect grid just like the -g option, but will also set it so the grid contains parallel and contraparallel instead of normal aspects. This feature works for the -g aspect and relationship aspect grids, and the graphics versions of them. The graphic glyph for the parallel aspect is two vertical parallel lines, while the glyph for contraparallel are two sets of two lines crossing each other, like a tic-tac-toe grid. In -gp affected charts, the parallel takes the place of conjunction, and contraparallel the place of opposition. All aspect orb settings affecting conjunction and opposition will affect the -gp aspects in the same way. (Note that the best orb for parallel aspects is only a degree or so, hence the default conjunction orb will likely be too high, and should be decreased with the -Ao switch for -gp grids.) The -A and -RA aspect selection switches will also affect -gp, but all aspects beyond the first two are ignored as only the parallel and the contraparallel aspects are considered.
-a: Display list of all aspects ordered by influence.
Aspects may be displayed in a nice ordered list, instead of only in the -g aspect grid. Use the -a switch and get a list of every aspect from the aspect grid printed out one per line. The order in which they are printed is based on the total “power” in the aspect, i.e. the influence of the two planets in question, the aspect in question, and the orb. The same info and data from the -j influence charts (see later) are used here, so changing any default influences there will affect this ordering. The two planets are printed, the aspect they make, their orb, and then the power of the aspect used in ordering. Any power number more than 10 is a very major aspect. An exact Sun Moon conjunction can exceed 25. So, if you want to know, say, if that exact Mars Jupiter conjunction is more powerful than that wide Sun Moon sextile, try a -a chart and find out what Astrolog’s opinion is.
-a0: Like -a but display aspect summary too.
This is just like the -a aspect list ordered by influence chart, except that summary information will be displayed afterward. The sum of all the aspect powers and their average is printed, the total number of aspects of each type is printed, and the total number of aspects to each planet is printed.
-aa: Like -a but indicate applying and separating orbs.
This is a shorthand way to bring up the -a or -a0 sorted aspect chart, with the aspect orbs shown as applying or separating, instead of positive or negative offsets to the exact aspect size. This is like how -ga does the same thing with the -g aspect grid switch. (To get the functionality of -aa without this, one can use the -ga switch itself along with -a, and then include -g by itself again, e.g. “-a -ga -g”, to toggle the aspect grid back off but leave the applying vs. separating setting on!)
-ap: Like -a but do parallel and contraparallel aspects.
The -a aspect list can be made to list all parallel and contraparallel aspects if invoked as -ap or -a0p, turning on the same flag as the -gp switch above. When in effect, the parallel aspects setting will also affect -D and -T transit influence charts, having them show their aspects in parallel too. This setting will also add results to the -d transit to transit times search, and the -t transit to natal times search, in which they’ll also list parallel aspects and when parallel transits happen (instead of only working with standard aspects).
-a[jonOACm]: Sort by power, orb, diff, planet, aspect, pos, midpoint.
The aspect list chart can sort the aspects it displays by several different methods. This applies both to the single chart and relationship comparison versions of the display. The -a switch can be followed by seven different subswitch characters:
-aj: Sort by power. High total power aspects appear earlier, and
lower power later. This is the default, and was the only option in previous
versions.
-ao: Sort by orb. Narrow orbs appear earlier and wider orbs later. This only
considers the “magnitude” of the orb, and will intersperse applying and
separating orbs among each other.
-an: Sort by orb difference. This considers the “sign” of the orb, and will
place all applying orbs or angles less than the aspect size before all
separating orbs or angles more than the aspect size.
-aO: Sort by planet. More specifically sort by the first planet listed, and
within each planet sort by the second planet listed.
-aA: Sort by aspect. Within each aspect, sort by planets as with the -aO
method.
-aC: Sort by zodiac position of the first planet listed.
-am: Sort by midpoint of the two planets’ zodiac positions.
-m: Display all object midpoints in sorted zodiac order.
True midpoint charts are supported in addition to the midpoints that can be seen in the -g aspect grid. Use the -m switch and get a list of all midpoints printed out sorted in zodiac order. This will show both the actual midpoint location, as well as the angular difference between the two objects displayed to the nearest minute. So if you want to see, say, if any important midpoint is close to your Sun, this is a much easier chart to use than scrutinizing the midpoint/aspect grid.
-m0: Like -m but display midpoint summary too.
This is just like the -m midpoint list ordered by zodiac position chart, except that summary information for it will be displayed afterward. The average number of degrees spanned between each planet pair is printed, and the total number of midpoints in each zodiac sign is printed.
-ma: Like -m but show aspects from midpoints to planets as well.
Aspects to midpoints are supported with the -ma switch. This feature will do the same as the -m midpoint list chart, except in addition to listing each midpoint, a sublist of each aspect in effect from a natal planet to the position of that midpoint, will be shown after it. The orb of the aspect will be printed too, where the orb will be shown as either wide or narrow, or applying or separating, based on the value of the -ga or -aa applying aspects setting.
-Z: Display planet locations with respect to the local horizon.
The text display switch -Z prints out where each object is on the local horizon in terms of altitude and azimuth. For each object, the following is displayed: Its altitude on the local horizon from +90 degrees (straight up) to -90 degrees (straight down), and its azimuth from 0 to 360 degrees, where 0 = due east, 90 = north, 180 = west, 270 = south. To make visualizing the azimuth easier, an “azimuth vector” with a N/S component and a W/E component is displayed, e.g. (1.00s 0.33w) means that the object is mainly south, with its true angle being formed by an vector component west that’s 1/3 the strength of the south component, i.e. the object is about 18 degrees west of south. This along with the altitude should make it easy to physically point to where any planet is at any moment, making it easy to locate planets in the night sky. This data can also be used to see when planets rise and set. Also displayed are altitude and azimuth differences between each object and the Sun and Moon, first showing the number of degrees that the Sun/Moon is “ahead” (or farther east in the zodiac) of the object in question, and then the number of degrees that the Sun/Moon is above the object in question. This feature can be used to roughly predict eclipses: Both the Sun and Moon span about 0.5 degrees in the sky, therefore if both the azimuth and altitude differences are < 0.5 (or 1.0 if the difference is between the Sun and Moon themselves) then the object in question is probably being occulted somewhat by the Sun/Moon. Note that there are three types of planetary position displays: Right ascension and declination showing the object’s position with respect to the stars, longitude and latitude showing where on the Earth the object is straight up (as in the astro-graph zenith locations), and finally azimuth and altitude showing the positions of the object relative to the local horizon.
-Z0: Like -Z but express coordinates relative to polar center.
This will do a text chart just like the -Z local horizon switch above except that it will print the location of each planet in prime vertical coordinates, instead of altitude and azimuth. Prime vertical coordinates are measured with its “azimuth” around the 360 degree circle, with 0 degrees due east on the local horizon, going down with 90 degrees straight down, 180 degrees due west and so on; declination “altitudes” are measured with positive values toward the north and negative toward the south.
-Zd: Search day for object local rising and setting times.
One can display the rising and setting times of the Sun, Moon, and planets with this feature. Specifically, when this switch is included, the program will, for the entire day specified in the chart information, display whenever a planet rises (specifically conjuncts the local horizon while in the eastern hemisphere), sets (conjuncts horizon in west), reaches its zenith point (or specifically conjuncts the meridian while in the southern hemisphere, i.e. is due south from the observer), and reaches its nadir point (conjuncts meridian in north). Note that some stars may be high or low enough that they will never rise or set, but instead will just “zenith” or “nadir” twice in a day as they spin around the pole.
-S: Display x,y,z coordinate positions of planets in space.
Solar system space based charts are available with the -S switch, which give the astronomical positions of each planet in terms of x, y, and z coordinates. Although not directly useful astrologically, it does give one a good view of how the planets actually were positioned at the time in question. For example, normal astrology doesn't make the distinction between the four different “forms” of say, a Mercury Venus Conjunction, i.e. they can either be Conjunct on the near side of the Sun, Conjunct on the far side of the Sun, or one can be on one side and the other on the other side. When the chart is actually displayed, for each body the following information is printed: The relative angle of the planet with respect to the central body, i.e. its zodiac position converted to the appropriate number from 0..360. This is followed by the x, y, and z coordinate positions of the object, in astronomical units from the central body. The x-axis increases in the direction of 0 degrees Aries (tropical zodiac), the y-axis increases in the direction of 0 degrees Cancer, and the z-axis is with respect to the Earth’s orbit (meaning that the Sun and Earth always have a z-axis value of 0.0). Finally the overall length from the central body in AU is printed, which is just the diagonal as indicated by the x, y, z vectors. (The Earth and Sun are of course always about 1.0 AU from each other.) The -e everything option will include this chart in its listing of all the chart displays.
-l: Display Gauquelin sectors for each planet in chart.
Astrolog supports Gauquelin sector charts. These are based on the work of Michael Gauquelin, with a sector chart basically a type of wheel chart where the planets are placed in their appropriate Gauquelin sector instead of zodiac sign at a given time. Sectors are numbered from 1 to 36, and indicate proportions of time between rising and setting. Sectors 1 through 18 are above the horizon, and 19 through 36 are below. When a planet rises it goes from sector 36 to 1, when 1/18th of the time until the moment it sets has passed it enters sector 2, and so on. A sector chart can be thought of as somewhat related to a standard wheel chart, except that it’s “time based” instead of “location based”. In interpretation, certain sectors are known to be powerful. These sectors are called plus zones and are the sectors immediately before and a bit after the four angles. For a more detailed account on interpretation, see books such as Gauquelin’s “Cosmic Influences on Human Behavior”. To bring up a sector chart, use the -l command switch.
The text mode version of this chart is similar to the standard -v listing. The chart info time and place will be displayed, after which, for each planet, the sector it’s in will be displayed, with a “+” indicating a plus zone, and a “-” indicating such is not the case (where with colored text active plus zones will be in red and minus dark green). Then as in the standard listing, the planet’s house, zodiac location, retrogradation status, equatorial latitude, and velocity will be printed. Finally will be displayed two alternative sector locations assuming systems where sectors go from 1 to 18, and from 1 to 12 (where for example the beginning of sector 36 will map to sector location 18.5, and 12.75, respectively). After this, summary information will be displayed. The number and percentage of planets that fall in plus zones (as well as the number and percentage of plus zones period) will be printed, and for each of the 36 sectors, the number of planets that fall in it and whether it’s a plus zone will be indicated.
-l0: Like -l but approximate sectors using Placidus cusps.
Calculating correct Gauquelin sector positions is based on rising and setting times, which require searches, hence computing the chart takes longer than regular wheels. It’s like the -Zd rising and setting list, in which increasing the -d searching divisions value increases the accuracy and calculation time here too. To cut calculation time down to that of ordinary charts, one may do a reasonable approximation of sector positions based on how far each planet has moves through a corresponding house (specifically house cusps divided using Placidus). To compute charts in this faster manner, invoke the -l switch as -l0. Note that since these sector positions are approximate, planets may appear to move in this chart when compared to the accurate -l chart.
-j: Display astrological influences of each object in chart.
Another chart type is available - interpretation of influences. This is part of the general interpretation ability of the program. What this chart does is calculate the relative “power” of each planet’s placement, giving a general idea of dominants or the prominent areas of a chart. In the chart, each planet is given a point value, with larger numbers indicating more strength. Each planet’s strength is divided between two fields: the positioning in and of itself, and the power of the aspects it makes with the other planets. In addition to each field, the total of these two areas is printed, as well as the relative percentage of the planet in question with respect to all the planets combined. Each planet gets a ranking for its positioning, aspects, and total power as well, with the strongest getting #1, the next strongest #2, etc. The -e option will include this chart along with all the others as well in its listing of all the chart displays.
To determine the strength of the positioning of a planet, various
things are taken into account:
1) The power of a planet in and of itself, e.g. the Sun and Moon are more
powerful than the other planets.
2) The house placement of a planet, e.g. a planet in the 1st house is more
powerful than one in the 2nd.
3) Whether a planet is in the sign it rules or is exalted in, e.g. Jupiter in
Sagittarius results in more power to Jupiter. Esoteric and Hierarchical rulers
will be considered too, if such rulerships are unrestricted (via the -YR7
switch).
4) Whether a planet is in the house corresponding to the sign it rules or is
exalted in, e.g. Jupiter in the 9th house.
5) Planets get more power if the signs they rule are occupied, e.g. a bunch of things
in Aquarius gives more power to Uranus.
6) Planets get more power if the houses they rule are occupied, e.g. a bunch of
things in the 11th house gives power to Uranus.
7) Finally, planets get power according to what houses the cusps of which fall
in the signs they rule, i.e. the ruler of the Ascendant (and to less extent the
Midheaven, and so on) gets lots of influence.
Determining the strength of a planet’s aspects is much easier, and
is basically composed of the sum of the strength of each aspect the planet
makes. Taken into account are:
1) The influence of the planet being aspected to, e.g. Sun conjunct Jupiter
gives more influence to Jupiter than Mercury conjunct Jupiter would. The planet’s
placement as described above plays a role, too, e.g. Venus opposition Mars in
Aries gives more influence to Venus that it would be if Mars were in Taurus.
2) The influence of the aspect itself, e.g. Oppositions are more powerful then
Sextiles.
3) Finally the orb of the aspect, i.e. exact aspects are more powerful than
wide ones. The influence of the orb varies linearly from max power at exact to
zero power at the limit of the orb. Sorry Maggie M. and Mark K. - no complex
aspect wave functions, at least for this version. :)
Special thanks goes to Mark K. who initially presented this idea of interpreting overall influences to me. I basically just started with his ideas, polished them a bit, and put it into the program. Interestingly, while programming this feature I had a dream about him, in which he elaborated upon some of the ideas and even gave me suggestions for some of the planets' default power values. Perhaps this was an astral plane visitation? :) While on the subject, I've had a couple of other Astrolog dreams; I had a neat one while working on the -h switch heliocentric feature about a far distant future version of Astrolog that could actually teleport one to the planets which they cast charts centered upon. :)
-j0: Like -j but include influences of each zodiac sign as well.
The -j planet influences in a chart feature can be expanded to
include signs as well. Invoke it as -j0 instead of just -j, and in addition to
getting the influence of each planet in a chart, one will get the influence of
each sign in the chart as well. To determine sign influence, we use the planet
powers already determined; a sign gets influence if:
(1) There is a planet in it.
(2) There is a planet in the house it corresponds to.
(3) If any planet that rules or co-rules it is in the chart.
For example, with my 11th house Venus in Sagittarius, for me: (1) Sagittarius gets more power because Venus is in it, (2) Aquarius gets more power because Venus is in the 11th, and (3) Libra and Taurus get power because Venus itself rules these signs. The exact power given is based on the total influence of Venus already determined. Any sign that has over about 175 points or 20% of the total is a really powerful and a fundamental part of the psyche. We also sum up the influences of all the signs (which will logically total up to the sum of all the planets), and display the influence of each element as well, and each mode as well, all this being perhaps a more accurate version of the element table in the -v chart.
-7: Display esoteric astrology and ray summary for chart.
A chart for esoteric astrology is available. It will list planets, showing the planet’s Ray, the planet’s position and the Ray(s) of its zodiac sign, and rulership information about the planet’s zodiac position and house position. That includes whether the planet exoterically rules or is debilitated in the sign (indicated with “R” or “d” characters), whether the planet esoterically rules or is debilitated in the sign (“S” or “s” characters), whether the planet Hierarchically rules or is debilitated in the sign (“H” or “h” characters), whether the planet exalts or falls in the sign (“X” or “f” characters), and finally whether the planet Ray rules or is Ray debilitated in the sign i.e. whether the planet’s Ray is the same as one of its sign’s Rays (“Y” or “z” characters). Finally the power of each planet is listed, based on its inherent strength, positioning, and aspects, which is computed in the same way as in the -j switch influence chart.
The esoteric chart also lists the seven Rays, showing the count of planetary sign positionings that are associated with that Ray, the total power of those planets, and the rank of each Ray’s total power and the percentage covered by that Ray. This can be used to see which Rays are most influential in a chart. The same counts and powers are repeated, however this time a sign associated with multiple Rays only contributes proportional slices of power. By default, each Ray is associated with three signs, so for balanced Ray coverage that gives each Ray an equal potential for power, the first “count” values are preferred. However, some signs are associated with one Ray, while others are with two or three, which means certain signs have triple potential to contribute power, so for balanced planet coverage that gives each sign an equal potential for power, the second “slice” values are preferred. For more about esoteric astrology in Astrolog, see: http://www.astrolog.org/astrolog/asteso.htm
-L [<step>]: Display astro-graph locations of planetary angles.
The '-L' option will take the standard chart information and generate the astro-graph positions of the planets. In other words, this does the exact same thing that Jim Lewis' Astro*Carto*Graphy maps do. It will display the longitude of where on the Earth at the time in question each object was on the midheaven and on the nadir, and the latitude of where the planets actually appeared at zenith. Also, for latitude increments of 5 degrees, the longitude of where the objects appeared on the ascendant and descendant is displayed. For text screens, one can pass an optional parameter to this -L (or -L0) option to change the default latitude step rate at which the Ascendant and Descendant lines are computed. Again, this value is by default 5 degrees, although one can may increase or decrease it to any integer.
-L0 [..]: Like -L but display list of latitude crossings too.
Determination of latitude crossing points is available in the astro-graph feature. The -L0 option will do the same thing as -L, except that after displaying the longitude and latitude locations of the Asc/Desc/MC/IC lines, it will then search among the lines and display (in order from farthest North to farthest South) the latitude of any points where lines cross each other. This includes the curvy Asc/Desc lines crossing the straight MC/IC lines as well as cases where different Asc/Desc lines cross themselves. Astrolog will also display the longitude of the crossing (useful for Asc/Desc crossings) in addition to the latitude. Display is from +90 to -90 degrees latitude, or more specifically stepping will include every degree before 90, so the default step rate of 5 will reach to 85 degrees. Note there is presently a small and rare minor omission in the code, where if a crossing is within a couple of degrees of 180 deg W/E, it may not be displayed.
-K: Display a calendar for given month.
The -K switch generates a simple calendar for the month specified in the current chart. This is a standard type of chart generatable from a date so the -e everything switch includes this -K chart along with all the others. Note that this is technically a non-astrological chart, but generic calendars are useful and easy to generate with all of Astrolog’s date determination features, so the option to create them using Astrolog is included. The calendars are compact, with one text row per week. The day specified in the current chart will be highlighted in green assuming -k Ansi color is active, e.g. “-n -K” will generate a chart for this month, with the number of today’s date highlighted.
-Ky: Like -K but display a calendar for the entire year.
The -Ky switch is just like -K except that it will generate a calendar for the whole year. All twelve months will be displayed on the screen, each just like the individual monthly calendars above but printed in four rows of three months each.
-d [<step>]: Print all aspects and changes occurring in a day.
The -d option will take the standard chart information, and for the day in question, display the exact times of all aspects that occur. This is just like the aspects-per-day as displayed in Jim Maynard’s Celestial Guide books. (Displayed in local time as defined by the default zone, with accuracy based on the searching divisions setting, described below.) This will tell any time two planets make aspects with each other, a planet changes its sign, or a planet goes retrograde or direct. Both the -d (and -t listed later) options will display the signs that any planets aspecting each other are in, in addition to the aspect itself (e.g. instead of just “Jupiter Trine Uranus”, we have “Jupiter (Vir) Tri (Cap) Uranus”. If a particular object is going retrograde, then its sign will be displayed in brackets instead of parentheses, and if an object is about to or has just gone retrograde or direct, then its sign will be in <>’s.
This display will also indicate when the Moon goes void of course. The Moon is void of course (v/c) between the time of the last aspect it makes and when it enters the next sign. The last aspect the Moon makes will be marked as the Moon going void of course, along with how long the Moon is void of course before it enters the next sign. There are different ways to measure the “last aspect” the Moon makes, and for flexibility Astrolog simply bases it on which aspects and planets are unrestricted. Note the Moon going void of course won’t be detected if a Moon aspect event isn’t displayed some time before a Moon sign change event in the list. That means the Moon and sign changes need to be unrestricted, in order for void of course periods to be seen.
This switch accepts an optional accuracy parameter, a value which tells how many searching divisions or “segments” we should divide each day or period, when doing these aspect searches. More segments is slower but can be more accurate by a few minutes. This command line change of the step rate can also be done for other charts such as the -t transit search by using the switch toggle feature to turn -d off but still leave the divisions value set, e.g. “-d 100 -d -t” will set the value to 100 but not actually display the -d chart. Or better yet just use the colon switch prefix to not affect the -d setting at all, e.g. “:d 100 -t”. In general, I suggest this value be set to around 48, but it is easy to experiment to see what is best for the speed of your computer. One may increase this value up to 2880 (if they don't mind the wait) which will mean a chart every 30 seconds for -d aspect in day charts and one every 15 minutes for -t transit search charts.
Note it’s possible for transit event searches to have too many events per time period. This condition requires having many objects unrestricted combined with a short searching divisions setting. If such a scenario does happen then an appropriate warning message will be displayed.
-dm: Like -d but print all aspects for the entire month.
The -d option can search the entire month for aspects between planets if one so desires. Specifying it as -dm instead of just -d will go through the entire month instead of just the current day. (Combining this one with -R allows searching for important aspects, sign changes, etc.)
-dy: Like -d but print all aspects for the entire year.
The -d option can search the entire given year for events as well, if it’s specified as -dy instead of just -d or -dm. Note that transit to transit event searches over an entire year or years may take longer to run. Because of this, these searches will divide the searching divisions setting by 10. That means a searching divisions parameter of 100 used for a yearly search will be equivalent to a searching divisions parameter of 10 used for a monthly search.
-dY <years>: Like -d but search within a number of years.
The -d search may also do a range of years all at once. Invoke the switch as -dY, and give a parameter indicating the number of years to span, and it will be done, starting with the year in the current chart. For example, to display the times of all New and Full moons for the next two years (2018 through 2019), do “astrolog -n -dY 2 -R0 sun moo -A opp”. (This is similar to the -EY and -tY features which also allow doing a range of years in addition to a single year or month.)
-dp <month> <year>: Print aspects within progressed chart.
Another progression feature allows determining aspect times of progressed planets among themselves. The -dp <month> <year> switch will, like the -d option, display times of aspects and sign changes, for the time around the chart in question, except that they will be progressed throughout the month specified. Progressed planets move very slowly (“year for a day”) so therefore there will usually be, if any, only a couple of aspects in a given month. Also, since they move so slow, the accuracy is cut down, so the dates given are probably only accurate about to the nearest day, in spite of the times given to the minute. Note that Astrolog can scan for aspects of: transiting planets among themselves (-d switch), transiting planets to natal planets (-T switch), progressed planets to natal planets (-Tp), and progressed planets among themselves (-dp). Only thing Astrolog can't directly do is do progressed planets to transiting planets, although that may change in a future version. :)
-dpy <year>: Like -dp but search for aspects within entire year.
Since progressed planets move so slow and only a few aspects in a progressed chart will appear each month, one might want to instead scan the whole year. To do this, use the -dpy switch, which takes only one parameter for the year. This switch is consistent in format to how with the -T and -E switches one specifies an entire year.
-dpY <year> <years>: Like -dp but search within number of years.
Related to above, the -dp option may also be done for a range of years. Invoke the switch as -dpY, and pass in not only the year to search within as with -dpy, but the number of years to scan from then. For example, do display the times of all aspects within your progressed chart for the next decade, do “astrolog -i yourchartfile -dpY 2018 10”.
-dp[y]n: Search for progressed aspects in current month/year.
The -dp progression event search option can be invoked as -dpn to search the current month, or -dpyn to search the entire current year. For example, if I want to search for the exact times of all aspects in my natal chart, progressed to any time this month, I simply do “-i mychartfile -dpn”.
-D: Like -d but display aspects by influence instead of time.
This switch will display a chart listing all aspects in effect within the chart in question, in order by influence based on their power when transiting. This chart focuses upon and gives precedence to aspects of outer planets with each other, as opposed to common inner planet configurations. For example, at the time in early January 1994 the most influential aspects in effect were the Uranus Neptune conjunction and the Saturn Pluto square. This chart is very much like the format of the -a aspect list chart, except that we are using the transit as opposed to natal influences of the planets. The -a chart is most appropriate for a person’s natal chart, in that the inner planets are focused upon, such as a Sun Moon square will be near the top of the list. This -D chart is more appropriate for times as opposed to people, since it focuses upon rare outer planet configurations. This chart is also very similar to the -T transit influence chart, in that it shows the aspect, applying or separating orb, and power of the event with its present orb, except that this does influences of transiting planets among themselves as opposed to aspects to a natal chart. If you want to see what major events are coming up, and don't want things such as Uranus Neptune conjunctions to “sneak by”, use this chart and watch the configuration gradually rise to the top of the list as its orb narrows over time. This chart may be combined with others and is included in the -e everything switch.
-B: Like -d but graph all aspects occurring in
a day.
-B[m,y,Y]: Like -B but for entire month, year, or five
years.
-B0: Like -B but don't restrict fast moving objects from
graph.
-V [..]: Like -t but graph all transits occurring during
period.
-V[d,y,Y] [[<day>] <month>] <year>: Like
-V for day, year, or 5 years.
-V[..]0: Like -V but don't restrict fast moving objects
from graph.
Astrolog has a graphical transit chart, which consists of a table of transit aspects, each aspect of which has its strength mapped over a period of time. The result makes it easy to see when an aspect enters orb, is exact, and leaves orb. These graphs also allow seeing cases when an aspect comes close to but never becomes exact, which is a situation missed by charts that only display times when aspects are exact. The transit graph comes in two forms: transit to transit, and transit to natal. Both forms can be displayed to show aspects within a single day, a single month, a single year, or a range of five years. Counting text mode and graphics mode versions of these charts, there are 2x4x2 = 16 different transit graph chart types total! The transit to transit graph is accessed via the -B command switch, which is identical in syntax to the existing -d transit to transit times search, including all subswitches. The transit to natal graph is accessed via the -V command switch, which is nearly identical in syntax to the existing -t transit to natal times search, including all subswitches. (One difference is that -B defaults to covering one day unless the appropriate subswitch is specified, while -V defaults to covering one month.)
The total number of different aspects that are active within the period may be high, especially when considering fast moving objects like the Moon and especially house cusps. Note that for graphic charts, if there are too many transits to fit within the screen height, then later aspects will be skipped. By default transit graphs don’t include aspects involving certain fast moving bodies (which means when the transiting body is fast moving in the case of -V). Graphs involving a single day will skip house cusp objects, graphs involving a month will skip the Moon as well, and graphs involving year(s) will skip the Sun through Mars as well. If the -B and -V switches are invoked as -B0 and -V0, then this automatic restriction won’t happen.
In text mode transit graphs, each aspect has its own row, and each character within a row represents a time period. If the aspect is within orb at that time, then a digit from 0-9 is placed there, in which “0” means the orb is 0-10% exact on up to “9” which means the orb is 90-100% exact. Peaks in influence (which usually but not always indicate when the aspect is exact or 100% within orb) are colored white to make them stand out better. Every row will have at least one high point marked, even if it’s on one of the edges where an orb is increasing at the boundary. In addition, the column corresponding to the time of the chart (or to the transiting time in the case of the transit to natal graph) will be marked with vertical bar characters. Transit graphs also come in a graphics version (unlike the existing transit time and transit influence charts which only have text versions). In the graphics mode transit graphs, each aspect has its own row, in which each row is a mini-graph plotting the aspect’s strength over time. Peaks and high points will be marked in white, and for the transit to transit case, the column corresponding to the time of the chart will be marked in dark green (unless the -Xi switch modify display setting is active). In the Windows version, whether the specific time is marked with a vertical line can be toggled with the “Graphics / Modify Chart” command.
-E: Display planetary ephemeris for given month.
The -E option will generate an ephemeris of the planet positions each day for the month indicated in the given chart, as taken from the standard interface. This is useful if you just want to see an overview of what’s happening some month in the sky. A dot after a planet location in the list indicates the planet was retrograde at the time that day. For example, to see the ephemeris for someone’s birth month, one can do the convenient “-i chartfile -E”, or to see the ephemeris for this month, do “-n -E” (see -i and -n options later). The -E text ephemeris switch may be combined with the -gp or -ap parallel aspects feature to generate an ephemeris of ecliptic latitudes (or equatorial declinations if the -sr flag is in effect) instead of the normal zodiac longitudes.
Note: The ephemeris listings obtain the time (and time zone) to cast each day’s chart for (e.g. noon, midnight) from the chart information given it, instead of always defaulting to something like midnight in the default time zone. This is a bit more flexible since one may want to specify a noon or 6:00am or whatever ephemeris which wouldn't be possible otherwise. The -qm <month> <year> switch (see later) always uses midnight for the time and the default for the time zone, so when using this switch with -E, the results will be a midnight ephemeris in this default zone. However, something like -i yourchart -E to do an ephemeris for your birth month will display the positions each day at your birthtime instead of at midnight.
Note: This chart will include house cusp and other fast moving objects that move around the zodiac in a single day, if such objects are unrestricted. In such cases, it’s important to remember that object positions in the ephemeris are only plotted once per day, so when an object such as the Ascendant changes only a degree or so between one day and the next, within the day the object did move around the entire zodiac.
-Ey: Display planetary ephemeris for the entire year.
To display an ephemeris for all twelve months in an entire year, invoke the -E switch as -Ey. For example, to get an ephemeris for all of last year, one can do “-qy 1995 -Ey” (see -qy and -qm options below).
-EY <years>: Display planetary ephemeris for a number of years.
The -E ephemeris list feature may also do an ephemeris for a range of years all at once. Invoke the switch as -EY, and pass a parameter indicating the number of years to span with the ephemeris, and it will be done, starting with the year in the current chart. For example, to do an ephemeris for all this century from 1900 through 1999, do “astrolog -qy 1900 -EY 100”.
-E[]0 <step>: Display ephemeris times for days, months, or years.
The text mode ephemeris can specify the step rate for ephemeris output. The -E0 switch is like -E, except it takes an extra parameter specifying the “step rate” factor of how often to display times. By default the ephemeris chart displays times once per day, however it can also be a given number of days, months, or years. The extra parameter should have the prefix “m” for a step rate in months, “y” for a step rate in years, and “d” (or nothing) for a step rate in days. For example, “-E0 d2” will display positions every other day, “-Ey0 m3” will display positions once every three months, and “-EY0 1000 y10” will display positions once every ten years. Slower ephemeris step rates are useful when displaying very slow moving objects, such as fixed stars in the tropical zodiac or planetary nodes.
-e: Print all charts together (i.e. -v-w-g0-a-m-Z-S-l-j0-7-L0-K-d-D-B-E).
There are 16 main different formats of chart display available: The standard listing of planet positions which you get without any switches or with the -v option, the house wheel you get with -w, the aspect/midpoint grid you get with -g, and the charts generated with the -a, -m, -Z, -S, -l, -j, -7, -L, -K, -d, -D, -B, and -E switches. The -e “everything” option will display the chart in all 16 of these formats for about 1200 lines and 75K bytes of text! Note that one can even include the -t and/or -T transit options below and include yet a couple more chart formats in the list (however transits require a time parameter to do transits for, so they aren't really a single chart display and hence aren't included in -e by default).
-t <month> <year>: Compute all transits to natal planets in month.
The '-t <month> <year>' option will scan the entire month specified, and print out any transits that happen, in that month, to the planet positions as listed in the current chart as taken from the standard interface. There will be often be quite a few events, even though fast moving objects like the Moon aren't looked at by default (unless specified in the default parameter file or with the -RT switch), so you might want to use this with the -R option to limit this to just certain planets. The times are displayed in the local time zone, and are reasonable accurate, where accuracy can be increased by upping the value in the -d searching divisions setting; try doing it for your birth month and your own chart - all planets should conjunct their natal positions at about the time of your birth. To determine transits to natal house cusps other than the Asc and MC, i.e. when does a planet change house in your natal chart, include the -C switch described elsewhere. See the -RT option, as well as the -YC “smart cusps” default, described later, for options which directly affect this feature.
This transit search supports 3D house ingress, and can display when planets change 3D houses, if the 3D houses setting is on (-c3 switch). Restricting a house cusp object will prevent display of planets entering the corresponding 3D house, and turning on the restrict sign change events in searches setting (-YR0 switch) will prevent the display of all 3D house events.
Note that even transiting house cusps (and other fast moving objects like the Part of Fortune, Vertex, and East Point) may be included in these transit to natal searches. (To activate transiting cusp objects use the -RT switch.) This allows one to determine the time of events such as when the Ascendant today conjuncts your natal Sun. Note that as the house cusps travel through all 360 degrees of the zodiac during the day, a cusp will make a transit roughly 30 times as often as even the fast moving Moon, the Moon itself making transits 12 times as often as planets like the Sun. So realize you may get a flood of information, and hence probably do want to restrict all planets and aspects you’re not interested in. Note also that to get accurate times for transiting cusp events, you probably want a high value for the -d searching divisions setting (I recommend at least 200) which means longer calculations.
-tp <month> <year>: Compute progressions to natal in month for chart.
Determining dates of transits of progressed planets to natal planets can be done with the -tp <month> <year> option. This is just like the -t option, except that the exact aspects of progressed planets (rather than transiting planets) to the planets in the chart are displayed. Progressions occur much less often than transits, and there will only be a few, if any, in a given month, so one might to invoke this as -Tpy, as described below.
-tr <month> <year>: Compute all returns in month for chart.
This switch is a quick and convenient way to compute solar, lunar, and other returns. As a return is when a transiting object conjuncts its natal position, returns are findable using the generic -t transit to natal search. However to only display returns with it and not every transit, one has to restrict aspects to just the conjunction, and restrict objects to just the one you’re interested in. (But even that will still show things in addition to returns if more than one object is unrestricted, e.g. with just Sun and Moon you'll still get Sun to Moon conjunctions and vice-versa.) The solution is this return feature, which (without altering your aspect or object restrictions any) works just like the -t switch, but displays only returns in the transit list, i.e. conjunctions between a transiting planet and that same planet in the natal chart.
-t[p]y: <year>: Compute transits/progressions for entire year.
To display transits for an entire year, invoke the -t switch as -ty (-tpy for progressions), which only takes one parameter, the year. For example, “-i chartfile -ty 2018”.
-t[p]Y: <year> <years>: Compute transits for a number of years.
One may search an arbitrary number of years at once for transits. The -tY <year> <years> switch is like the -ty <year> switch, except that -tY takes an extra parameter for how many years to search. For example, -tY 2015 10 will search the ten years from 2015 through 2024 for whatever transits. With a negative value for the years to scan, it will start that many years before the given year, e.g. -tY 1999 -10000 will scan the previous 100 centuries for transits, starting with 8002 B.C.! Note that this switch may also be invoked as “-tYn <years>”, in which case it will start from the current year and be an equivalent shorthand to “-tY 2018 <years>” for this year at least.
-t[py]n: Compute transits to natal planets for current time now.
This feature is a quick shorthand way to generate transits for the current month. For example, instead of “astrolog -i chartfile -t 1 2018”, one can do “astrolog -i chartfile -tn”. To do transits for the entire current year, invoke it as “-tyn”.
-T <month> <day> <year>: Display transits ordered by influence.
The -T switch is a transit influence chart. Given a date, it will take the transiting planets on that date, and determine how they interact with the generic natal chart specified with -i or however. The information will be printed as a list of transits, sorted in order from most significant to least significant. For each transit in effect, the transiting and natal planets (and the signs they are in) are displayed, along with the aspect and the orb, and whether the transit is applying and going to happen in the future, or just passed exactness and the orb is separating. The computer computed power value of each transit will be printed too, in which anything over 100 is a very major transit. Any transit that’s a return, i.e. a transiting planet conjuncting the same one in the natal chart, will be flagged with a capital “R” at the end of the line.
The things which affect how Astrolog computes the influence of a transit are: The power of the object that’s doing the transit, e.g. transiting Pluto conjunct your natal Ascendant is much more powerful than the transiting Moon conjunct your Ascendant. The power of the object being transited affects the power too (but not as much as the transiter) e.g. Jupiter transiting your Sun is more powerful than Jupiter transiting an asteroid. Finally, the orb plays a role as well, in that a transit that will be exact in a couple of days from the given date passed to -y is more powerful than one won't be exact for another month. Note that the power of a planet when transiting is different than its influence in the natal chart: Although Sun conjunct Moon is more powerful in a natal chart than Saturn conjunct Moon, when transiting, Saturn transiting Moon is much more influential than Sun transiting Moon. Hence there are two lists of object influence values in the astrolog.as file (described later) that can be customized. There’s the generic list of standard influences (which have items like Sun, Moon, and Ascendant most powerful), and a parallel list of transit influences (which have the slower moving bodies the most powerful).
Related to the -tr switch above, the -T switch can be invoked as -Tr, which is the same as the general transit influence chart, but will only display aspects between a transiting planet and the same natal planet. (Note unlike -tr it will include aspects other than the conjunction.)
This switch is in compliment to the -t transit search list, and you may find this one more useful. The -t chart prints the times when a transit is exact, which is useful to know, but doesn't really help when you want to know when a transit enters orb enough to be significant, and it won't flag a major year long transit that will be exact next month, listing it among a bunch of less significant aspects for the following month. With -T, you can see a major transit first enter orb at the bottom of the list, and then slowly rise to the top as it becomes more exact through the days. And you can answer the question as to which is more influential: say an exact transit of Mars to a minor house cusp, or a major transit of Saturn to an angle that’s still a month away from exactness.
Also notice the resemblance between -T and the -r0 -a combination. Both display aspects ordered by influence. In fact, “-i chart -Tn” will look almost identical to “-y chart -a”, except that -T is designed and formatted for doing transits to a particular chart. (Doing -T will always use applying vs. separating orbs, generate powers using the transit influences, and allow the transiting and natal planets to be restricted separately with -RT and -R.) Astrolog allows transit charts to be done between transiting planets and natal planets, as well as charts among transiting planets to themselves, both of which can be expressed as searches for exact times, or displays of influences of each aspect at a particular time, as summarized in the following organized list:
-t switch: Display exact times of transits to natal planets.
-T switch: Display influences of transits to natal planets.
-d switch: Display exact times of aspects among transiting planets.
-D switch: Display influences of aspects among transiting planets.
-Tt <month> <day> <year> <time>: Like -T but specify time too.
The -Tt switch is just like -T, except in addition to month/day/year parameters for the transit influence chart date, it also takes a fourth parameter for the time within the date.
-T[t]p <month> <day> <year>: Print progressions instead of transits.
The -T transit influence switch can also (like the -t transit search) display all aspects between progressed planets and natal planets in influence order, if it’s invoked as -Tp instead of just -T. This works like -T in every way except that a switch combination like “-i mychart -Tp 12 31 2018” will display aspects between my natal planets, and those in my natal chart progressed to the end of the year, and their influence and orbs at that time, instead of between my natal planets and the actual positions of the planets at that time.
-T[p]n: Display transits ordered by influence for current date.
The -Tn switch is a shorthand way to pass the current date today and time now to the -T switch. If you want to see what transits are most affecting your natal chart presently, just do “-i yourchart -Tn”.
-P [<parts>]: Display list of Arabic parts and their positions.
Astrolog has the ability to display the positions of 177 Arabic parts. The “ARABIC” compile time option in astrolog.h may be commented to leave this feature out if you don't want it. Display a chart with the -P switch to show each part and its position, one per line for the chart in question. The listing contains five columns: First is the name of the part, which is usually called in full “The Part of <name>”. Second is its position in the zodiac (which will be shown to the nearest arc second when the -b0 setting is active). Third is the house the location falls in.
Fourth is the formula used to compute the part, given so one knows what the program is doing and to aid in interpretation. The formula is expressed in the form <term1> - <term2> + <term3>. Also included is a flag indicating whether the formula should be flipped for night births, i.e. charts where the Sun is below the horizon in houses 1 through 6. For night charts where the flip status is “Y”, the real calculation done is <term1> + <term2> - <term3>. Each <term> consists of an “object” plus a “modifier”. The object is usually given as the abbreviation of a planet, or it may be a number from 1 to 12 indicating that house cusp. The object may also be “For” or “Spi” meaning it’s the position of the Part of Fortune or Part of Spirit, or it may reference an actual degree in the zodiac. The modifier indicates how to get the actual position of the term from the object. It’s usually blank meaning the term is just the position of the object. It may be “H”, meaning the term is the location of the house the given object is in; it may also be “R”, meaning the term is the location of the planet ruling the house the given object is in; it may be “D”, meaning the term is the location of the planet that’s the dispositor of the given object, i.e. ruler of its position; or it may be “&”, meaning the term is 10 degrees beyond the position of the given object.
The last column is the “type” of Arabic part. Most parts are normal psychological indicators like the Part of Fortune, and don't have anything listed here. Seven parts reference elements and weather and are used for charts cast at the time of equinoxes, solstices, and New and Full moons, and are indicated by “Event”. 21 parts reference crops and are parts used in the commodities market for prognostication, and are indicated by “Comm”. Finally 16 parts are specially used for Horary questions and are indicated by “Hora”.
The -P switch accepts an optional parameter to indicate how many of the Arabic parts to show. When given, only the first 'n' parts will be displayed. As the special part types are shown after all the standard ones, this may be used to restrict parts you don't care about. For example, “-P 161” will leave off the horary parts, “-P 140” will leave off the horary and crop parts, and “-P 133” will leave off the horary, crop, and event parts. Related to this, standard -R object restrictions will affect the parts shown; if a planet is restricted, than any parts referencing it in its formula will be left out.
-P0 [<parts>]: Like -P but display formulas with terms reversed.
If the -P switch is invoked as -P0 (or -Pz0, etc) the output will be identical to before, except that the formula column will exchange the positions of the second and third terms, i.e. instead of showing as <term1> - <term2> + <term3>, -P0 will show <term1> + <term3> - <term2>. This isn't too useful in itself, unless combined with -Pf below, where -Pf and -Pf0 sort differently giving different terms priority. Here’s how to conceptualize formulas: if the planets were rotated through the zodiac so that object2 is at the position of object1, then the new position of object3 is the part. For example, with the Part of Fortune being Asc - Sun + Moo for daytime charts, if you rotate your chart so that the Sun is on the Asc, then the Moon’s position is the POF, Mercury’s position is the Part of Commerce, its formula being Asc - Sun + Mer, and so on. The default -Pf sorting allows one to easily see, if one rotates this planet on the Asc, what parts indicate the positions of the other planets. The -Pf0 ordering allows one to easily see, where is the position of a particular planet, after all rotations where some other planet is on the Asc.
-P[z,n,f]: Order parts by position, name, or formula.
As with the fixed stars, the Arabic part listing may also be sorted in various useful orders. Invoke the -P switch as -Pz and they will be displayed in order of position, with parts in Aries first and Pisces last. Invoke it as -Pn and the parts will be sorted by name, with the part of Accomplishment first and Worldliness last. Finally, invoke it as -Pf and they will be ordered by formula, where the ordering reflects the contents of each term, with Ascendant and early planet terms first, and cusp and other special ones last. Note that regardless of the ordering, passing a value to -P will still leave off the same parts as in the standard display. Especially with -Pz and -Pf, notice that several parts may have the same position. Some formulas differ only in their night flip flag, meaning they will be the same for day charts, while a few parts of different category types can even have the exact same formula.
-I [<columns>]: Print interpretation of selected charts.
The -I display an interpretation option is an expansive feature to generate interpretations of many of Astrolog’s charts. Simply include the -I switch to get an interpretation of any particular type of chart that the program would display otherwise. If Astrolog doesn't support interpretations for it, the normal chart will be shown instead.
For example, A brief interpretation of the meaning of the positioning of each planet in its sign and house is supported when the -I switch is invoked with -v (or by itself since -v is the default). If one does this, then instead of the standard -v listing of planet positions, the positions will be listed with a brief interpretation of what they mean. I have to say that this is a pretty limited version of interpretation, being nothing more than a combining of phrases representing the planet, sign, and house in question; nevertheless, people who aren't experts at interpreting charts might find this to be of use (or at least amusing. :)
Another common interpretation one would want is the ability to give a brief interpretation of each aspect in the aspect grid. When the -I switch is combined with -g, the standard -g aspect grid will be replaced with a list of each aspect occurring and a brief listing of what it means. Again, this is mainly just a lookup of the general meanings of each planet and the aspect in question, but still might be found of interest by some. (Note: only the first 11 aspects, out to the Bi-Quintile, will be considered.)
Synastry relationship charts may be interpreted too, with the -r -I combination. Actually, they could be technically interpreted without any special code, since the output of a synastry chart is a technical “chart” with planet and house positions, but it would just be an interpretation of Person2’s planets in Person1’s houses as if that were a natal chart. This interpretation feature recognizes charts generated with -r as synastry charts and interprets them appropriately. For each of Person2’s planets, the interpretation of how and where it affects Person1 is displayed.
Eight more interpretations just as useful can be done: “-r0 person1 person2 -g -I” is a legal combination, and will display meanings of aspects between planets in two charts in a relationship aspect grid. “-i person -a -I” is legal, and will display the meanings of aspects in a chart; this is like -g -I, but the aspect meanings are printed in sorted order based on how powerful Astrolog thinks each aspect is, so this is probably more useful. “-r0 person1 person2 -a -I” is legal, and will display the meanings of aspects in a relationship aspect list, like -r0 -g -I, but in the improved sorted order. “-d -I” is legal, and will display the meanings of aspects among transiting planets occurring during a day, as well as of sign and direction changes. “-t -I” is legal, and will display the meanings of aspects from transiting planets to natal ones. “-T -I” is also legal, and will display the transit interpretations in sorted order by influence. Finally, “-m -I” is a legal combination, which will do an interpretation of a midpoint chart, printing each midpoint in the same order as without the -I, but with each midpoint as an interpretation sentence instead. Relationship midpoint charts may be interpreted in the same manner using the “-r0 person1 person2 -m -I” combination.
In displaying interpretation text, the program will use the name or title field of the chart (exactly as entered by the user or as passed to the -zi switch) when referring to a person. If this field is empty, the program will use the generic labels “this person”, “person1”, or “person2” as appropriate. Also in interpretation text, the “Fortune” object will be displayed with its full name “Part of Fortune”, and similarly the asteroid “Pallas” will be displayed with its full name “Pallas Athena” (unless one has used the -YD switch to change the name of those objects).
This interpretation toggle switch accepts an optional parameter to specify the number of screen columns in which to format the interpretation paragraphs, i.e. what column to break lines at when formatting and printing. One may change this from the default of 80 to accommodate narrower or wider screens or printers.
Switches which affect how the chart parameters are obtained:
-n: Compute chart for this exact moment using current time.
For those with systems who can handle time calls (If your system errors on trying to compile them, simply comment out the #define TIME line at the beginning), the program supports displaying the chart for the time at the current moment! In other words, invoke as astrolog -n and see where the planets are right now. (This is fun - the house cusps change one minute about every four seconds!) You will need to change the #defines for the default longitude and latitude in astrolog.h, or else specify where you are explicitly by using the -zl switch to change the default location. To figure out the time zone, the program uses the default value in the astrolog.as file or as defined in the DEFAULT_ZONE constant set at compile time.
Note that the default time zone setting or passing values to -z, won't affect the positions of the planets, which is expected since they are where they are “now” no matter how time is expressed. The default zone is merely used to determine what to express the local time to when displaying the current time. It is important however to realize that the time zone setting on your system can affect the actual raw time the program gets internally for “now”. If the -n switch seems to always generate times an hour or more off to what you have your time zone set to, it’s likely that your time zone environment variable is uninitialized or set incorrectly. You will need to set the “TZ” environment variable, setting it to a value such as “xxxnyyy”, where 'n' is the hours your zone is before UTC/GMT, 'xxx' is a three character string indicating the abbreviation of the zone (required, but doesn't need to be set to anything more than 'xxx' if you prefer) and 'yyy' is the abbreviation for the zone when/if ever in Daylight Time. For example, if running Astrolog on a PC in Eastern Time, put the line “set TZ=EST5EDT” in your AUTOEXEC.BAT file. Another way to correct your “now” charts if they always seem to be off by a certain number of hours is to use the -Yz switch (described later).
-n[d,m,y]: Compute chart for start of current day, month, year.
These switches are like the -n generate chart for current moment now feature, except that they will respectively generate charts for the midnight on the current day, midnight on the first of the current month, and midnight on the first day of the current year.
-z [<zone>]: Change the default time zone (for -d-E-t-q options).
The -z <value> option can be used to change the default time zone to the value in question. For example, you can force the -E ephemeris and -t transit lists to be displayed at midnight UTC/GMT time instead of the local time with “-z 0”. If Daylight time is in effect, you should set the separate Daylight time default below. Note that one can technically get by without changing the Daylight setting, by subtracting one from the time zone itself, e.g. for EST where the time zone is “5”, you can do “-z 4” or “-z EDT” during Daylight time to properly display transits, aspects in day, and other lists in the local DST zone.
Normally the -z switch takes an argument which will then become the default time zone. If one, however, invokes it by itself, it will subtract one hour from whatever the default time zone presently is. This is useful since it is equivalent to adjusting any times printed to Daylight time, i.e. it will add one hour to any times displayed. Again, this is archaic as it’s better to just use the -z0 switch below. Without the -z0 setting, when entering the birth time for charts, one would have to subtract one hour if Daylight time were in effect, or subtract one hour from the time zone which will do the same thing. For example, over here on the West Coast, I have my default time zone compiled to be “8"; when Daylight time is in effect here, I can do -z 7 or just -z to decrease the default time zone when I make say a -t transit list, which will in effect add one hour to the local times displayed, or in effect “Spring ahead” the clock for me. (For a better way of adjusting Astrolog for Daylight time without having to specify -z all the time, recompile the program, or add one hour to times in your head, use the “defaults” file described later to edit the default time zone or the Daylight setting.) Remember that the -z (and -zl) switches should be before any other switches they modify (such as -n) in order for the new default to take effect.
-z0 [<offset>]: Change the default Daylight time setting.
This switch sets the contents of the default Daylight time setting, and sets the value in the current chart as well, taking one optional parameter. When present the parameter will be used for the Daylight hour offset, which will almost always be 0 or 1, but can technically be set to something else for Daylight offsets that “Spring ahead” amounts other than one hour. When omitted, the -z0 switch will toggle the Daylight setting on and off between 1 and 0. In addition to “0” and “1”, this switch also accepts “n” and “y” (for “no” and “yes”) as parameters.
The -z0 switch will also accept “autodetect” (which may be abbreviated as “auto” or “a”), in order to compute whether Daylight time is on or off at the current moment. This allows charts for “now” to automatically use Daylight time when the computer’s internal clock is using it. For example, an animation continually updating to the current moment will change to or from Daylight Time at the second the annual switchovers take place. Without this option one would have to manually change this switch in their default settings file twice a year. Presently the “auto” value is only implemented to detect this in the Windows version, and will default to Daylight time being off on different platforms.
-zl <long> <lat>: Change the default longitude & latitude.
Similar to the -z switch, the -zl option can be used to change the default compile time world coordinates used in certain options, such as the -n cast chart for right now switch. Note that both the -zl default longitude and latitude, and the -z default zone switches affect the time and location of the current chart in memory in addition to the default setting. Confusion could result otherwise if changing a default after chart info was already obtained, e.g. “-z -n” would be different from “-n -z”, where the latter wouldn't change the zone for the chart because it was seen after the -n was processed and the old zone used. The correct thing will happen regardless of ordering. This means you can easily do a relocated chart with this -zl switch, e.g. “-i yourchart -zl 122W19:59 47N36:35” will cast your chart relocated to Seattle.
-zv <elev>: Change the default elevation above sea level.
The default elevation used in topocentric charts may be specified with this switch. Elevation above sea level can be expressed in meters (with an “m” suffix) or feet (“ft” suffix). Note that this is a global setting, so affects all charts. To fully support topocentric astrology, the standard interface for specifying time and location should also ask for elevation above sea level (although that piece of information would of course be unnecessary for standard non-topocentric charts). As an example, changing from sea level to the top of Mt. Everest (29028 ft, or 8848 m) can change the topocentric position of the Moon by up to four arc seconds.
-zj <name> <place>: Change the default name and place strings.
The default name and location strings used for charts (most commonly for “now” charts) may be specified with this switch.
-zt <time>: Set only the time of current chart.
This simple switch will set the time and only the time of the current chart in memory to the given value. For example, to cast a chart for 3:00pm today, do “-n -zt 3:00pm”. Without this one would have to cast a whole new chart using the -q switch and respecify the month, day, and year. Note that placement of this switch is important, as any other switch after it which also sets a time will clobber the setting, e.g. “-zt 3:00pm -i chartfile” will be the same as just “-i chartfile” because the file has its own time value.
-zd <date>: Set only the day of current chart.
This is just like the -zt switch above except that it takes one parameter for and sets the day of the current chart. For example, to see the aspects taking place on the 15th of the current month, do “-n -zd 15 -d”, which does the chart for the current month and year but the day scanned is the 15th instead of the current day.
-zm <month>: Set only the month of current chart.
This simple switch will set the month and only the month of the current chart in memory to the given value. For example, to display an ephemeris chart for July of this year, do “-n -zm July -E”.
-zy <year>: Set only the year of current chart.
This is just like the -zm switch above expect it will set the year and only the year of the current chart in memory to the given value. For example, to display a chart for your birthday next year, do “-i yourchart -zy 2018”.
-zi <name> <place>: Set name and place strings of current chart.
This switch sets on the command line the contents of the name and city string fields of the current chart. Note that this switch is actually put into present style chart info switch files generated with -o to reload the name fields. You can convert an old style file created before version 4.20 to new style and add in the name fields for it with: -i file -zi "the name" "the city" -o file. (Note that you may also want to correct the time or time zone if Daylight time was in effect though.)
-q <month> <date> <year> <time>: Compute chart with defaults.
The -q <month> <date> <year> <time> option takes the four parameters and casts a chart for the time in question. The time zone and location are taken from the default compiled values. This is just yet another useful shorthand way to quickly make a chart. Note that the -qa option which takes all seven chart parameters can be duplicated with -q along with the -z <zone> and -l <long> <lat> options.
-qd <month> <date> <year>: Compute chart for noon on date.
The -q <month> <day> <year> option can be used to cast a quick chart for 12 noon on a particular date, using the default longitude and latitude, and time zone. One example where this is useful is with the -d option, e.g. to see the times of exact aspects on a particular date, like your next birthday, your finals, etc, without having to specify unnecessary data. Note that this is just like the -q switch except that -q requires a specific time on the day in question as well.
-qm <month> <year>: Compute chart for first of month. -qy <year>: Compute chart for first day of year.
A quick chart cast for midnight on the first of a month can be generated with the two parameter -qm <month> <year> switch. A chart cast for midnight on the first of January of a year can be generated with the one parameter -qy <year> switch. Both of these use the default time zone and location. These switches are most useful for charts that don't require all the standard information. For example, to get an ephemeris for December 2018, do “astrolog -qm 12 2018” and avoid having to enter in a day, hour, or location that wouldn't have any effect. These options are in similar to the -qd <month> <day> <year> switch above that will do a chart for noon on the given date, and the -q <month> <day> <year> <time> switch that takes a time as well.
-qa <month> <date> <year> <time> <zone> <long> <lat>: Compute chart automatically given specified data.
Normally one generates a new chart by entering the data coordinates interactively. A fast typist familiar with the program might prefer to give all the info at once, which can be done with this option. Simply list the seven parameters above, in the exact format as they would be given to the program were the user being prompted for them. (Note that it’s probably better to use the -qb switch below because of its extra parameter; the -qa switch will automatically assume Daylight time is off.)
-qb <month> <date> <year> <time> <daylight> <zone> <long> <lat>: Like -qa but takes additional parameter for Daylight offset.
This switch is just like the -qa switch above except that it takes one extra parameter for the Daylight Saving time flag. In order, the eight parameters for -qb are Month, Day, Year, Time, Daylight offset, Time Zone, Longitude, and Latitude. (Like -zi this switch is also put into chart info files by -o.)
-qj <day>: Compute chart for time of specified Julian day.
This switch will automatically cast a chart for the given Julian Day. Unlike the other -q switches which take standard months, days, and years, this switch takes one parameter for the Julian Day (which may be fractional to specify a time within the day in question). For example, another way to cast a chart for Midnight, UTC, on New Year’s day of 2018 is with “-qj 2458119.5”. (Julian Day 0 refers to Noon UTC, January 1, 4712 BC.)
Note: If the Swiss Ephemeris and Placalc ephemeris files are turned off, and only the ancient Matrix formulas are being used, then the program will have to use an older version of the Julian day conversion routines which will result in these -qj charts giving incorrect results for dates in the Julian Calendar, i.e. before October 1582. This can be seen by casting a chart with -qj specifying a day less than 2299161.5, in which case the Julian Day displayed for the date of the chart cast will be ten days greater than what was passed to it.
-i <file>: Compute chart based on info in file.
See the -o option below.
Note that there is a “virtual file” named “set” which can be passed to the -i and -r switches. Instead of looking for an actual disk file, this represents the “last” set of chart information dealt with, and is useful to avoid having to manually enter information in certain cases. (Other “virtual files” Astrolog can use are “now” which means the current time at the default location, and “tty” which means prompt the user for the info.)
This is best used within a -Q loop. For example, you first manually enter the time for a chart and it’s displayed. Now, this time in the loop, you want the same chart in an aspect grid, and don't want to have to enter the data again or create a file to read from. Entering “-i set” will use this chart info no matter how it was entered. For graphics charts this “last” chart will be set to the initial chart or whatever animation situation was saved via the 'o' key. Perhaps the most useful ability of the “set” chart however is that it will set itself to times that appear in -t and -d transit and aspect in day searches. For example, if you want to cast a chart for the New Moon this January, first do a combination like “-qd 1 20 2018 -d -R0 Sun Moo -A 1”, which will scan the 20th for Conjunctions involving the Sun and Moon, and display the time. Before, to get a New Moon chart one would then have to manually specify the time displayed. Now, just “-i set” will bring it up!
The initial contents of the “previous” chart, i.e. what you get by directly doing something like “astrolog -i set” are initialized to the astrological “chart” for the release of this version 6.40 of the program itself, which is the time of the solar Leo ingress, specifically for 2:00:21pm PDT (7 hours before UTC) on Sunday, July 22, 2018 for Seattle, WA (122W19:59, 47N36:35).
This is one more “virtual file” that’s obscure and only useful in certain circumstances, named “nul” which may be passed to the -i file input or -r switches which take chart info files for parameters. The file “nul” means to not change the chart info parameters any, but rather leave them with whatever current settings they may have or were set to before. This is mainly useful with the -r switches if you don't want to have to create two actual files to pass in, or use the virtual file “tty” and have to enter in data interactively. For example, to see what your biorhythm is like for the beginning of December, do “astrolog -qm 12 2018 -rb nul yourchart.as” on the command line and no further input is needed.
Note that specification of command switch files doesn’t require the default “.as” extension. For example, “-i mychart” is equivalent to “-i mychart.as”, and the program will check both names before saying a file doesn’t exist.
If the program is invoked with a single parameter that doesn’t look like a command switch (e.g. “astrolog file.as”) and that parameter exists as a file, then the command line will be converted to a parameter being passed to the -i switch (e.g. “astrolog -i file.as”). This is not only a convenience, but is also needed internally because the Windows “Open” verb is implemented by launching the program and passing it the file as a parameter.
-i[2,3,4] <file>: Load chart info into chart slots 2, 3, or 4.
If the -i chart file load switch is invoked as -i2, it will do the same thing as -i except put the chart info into the “second” chart slot, for use with relationship charts. This does not enter or leave any relationship chart mode. One can set what chart info each wheel ring in the tri-wheel and quad-wheel charts will contain by putting a number after the -i switch to load the chart info from a file into that slot, where -i3 will load into the third slot, and -i4 into the fourth (where -i2 will again load into the second, and -i1 or just -i into the first). One can also do -it to load into the transiting time (which is normally set by parameters to transit chart selection switches such as -t, -T, and -V), and do -is to load into the “previous” chart slot (which is normally looked at as an input parameter, namely the “virtual file” named “set”).
There are special virtual files named “__1” through “__4” which represent the current contents of the four chart slots, which can be passed to this and other switches that read in chart files. These virtual files can be used to copy chart date/time fields. For example, the command switch “-i2 __4” will copy the contents of chart #4 to chart #2. There’s an additional virtual file named “__t” which represents the transiting time.
-o <file> [..]: Write parameters of current chart to file.
The program supports directing chart information to, and reading output from, data files. The '-o' option will dump all the birth data (the date and location, not the planet positions) to the specified file. The '-i' option will cast the chart based on the info in the file. (This allows you to put your birth data into a specific file, and cast your chart whenever you want to after that without having to reenter your birth data all the time.)
Another file output feature, the ability to concatenate “comment lines” at the end of a data file, is included with both the -o and -o0 options, as you may wish to say keep track of info other than the program supported name and city. After scanning the filename, the -o[0] option will then write any parameter that follows it at the end of the file, until a parameter beginning with a '-' or '/' (the next obvious command switch) is reached. For example: -o <file> "Birth certificate" Family, will add extra info indicating the source of my birth data, and a general category for the chart, in two separate lines at the end of the file. (On most systems, quotes can be used to allow spaces within one parameter.)
-o0 <file> [..]: Like -o but output planet/house positions.
Ability to write the actual sign and house positions of a chart to a file (instead of just the time and place) has been implemented via the -o0 <file> option. This option can be used interchangeably with the -o output to file switch. The information written includes the zodiac position of all unrestricted objects, their retrograde velocity, latitude, and distance, as well as the positions of the house cusps. (The chart name strings as set with the -zi switch are written out too of course.) This file information can easily be passed into another program, and can be read back into Astrolog with the -i option. The -i option will automatically determine which type the file is, and will either use the given positions, or else calculate them as needed. (Note that some switches, such as the -c house system selection, will have no effect for this file type.) Check an example of one of these files to see the precise format (a zodiac position is recorded as three numbers: degree in sign, sign as number 1 through 12 or three letter abbreviation, and floating point minute within the degree.) When the files are read back in, they will be flagged as “having no space or time” like the composite charts in the chart header displays.
This file format can allow one to do things such as transits to composite charts (send the composite chart to file with -o0 option and then read in the file with -i when using the -t switch) composites between two composite charts (use -rc between two composite charts sent to a file) and even, if one is willing to do a small amount of editing, to do transits to midpoints or the 0 degrees Aries point. Note that one can easily edit the positions in the -o0 position file to be whatever they like, so one could replace some unimportant object (e.g. the Vertex) with 0 degrees Aries or an important midpoint value. Note that trying to still use the -o time and space output with a chart in memory that doesn't have space/time will confuse the program; it will either say it can't make the file or else will output the time/space of the most recent parameter file it read in.
Note for old style -o0 position files created before version 4.20 that aren't based on command lines (see -Yo switch later): the positions of the eight Uranians may be output to those planet position files in addition to the 20 main objects, but only if the Uranians are actually calculated with -u in effect. Hence those position files can be of two different lengths, but the program will be able to read in both formats, leaving the Uranians uninitialized at zero Aries if they aren't also in the file.
-os <file>, > <file>: Redirect output of text charts to file.
This switch, given a file, will output the contents of a text chart to that file. This is just like output redirection (i.e. “> textfile” at the end of a command line) except that it’s implemented within the program. Hence unlike output redirection it will work from within a -Q loop, from the File Run menu in Microsoft Windows, and on systems whose shells don't allow redirection at all. This also has the advantage in that prompts and user messages won't be sent to the file, hence things can be done such as “astrolog -os textfile”, where the program will still prompt you on the screen for the chart info, but the chart itself will still go to the file.
The -os switch may also be expressed as ->, which is included as a convenience with its similarity to the “>“ output redirection featured in many shells. As with all switches, one may leave off the dash and invoke it as just “>“. When just “>“ is included on the command line, the system’s own output redirection will tend to be used. This switch allows one to also include “>“ when prompted for command lines within the program, or when running from MS Windows, where the shell plays no part.
Switches which affect what information is used in a chart.
-R [<obj1> [<obj2> ..]]: Restrict specific bodies from displays.
The ability to restrict the transit (-t) and daily aspect (-d) scans to just certain bodies has been implemented with the -R switch. Using -R by itself will prevent the asteroids, Chiron, Lilith, the Part of Fortune, East Point, and the Vertex from being in any of the charts. One may also give a list of one or more numbers representing planets to be ignored (e.g. 1 = Sun, 2 = Moon, 3 = Mercury, etc) or specify planet abbreviations directly, so that a complete custom setup can be obtained (e.g. “-R 1 2 3 4 5” or “-R sun moo mer ven mar” will cause all of the inner planets to be ignored). More than one -R switch can be combined (e.g. -R -R 16 will cause the asteroids, etc, and the North Node to be ignored; the first -R gets rid of the asteroids, etc, and the second one deletes the North Node.) Also, specifying the same particular body more than once will cause it to be included again, or in other words, -R <objectnum> complements the status of whether it is to be ignored or not (e.g. -R -R 15 will cause all of the asteroids, etc, excluding Vesta, to be ignored; the first -R makes causes the asteroids to be ignored, and specifying Vesta in the second -R makes it reappear.)
Note that Astrolog will compute charts faster when objects are restricted, since it doesn't bother to compute locations that aren't needed or used. For example, the search of a year for a Solar Return (-i chart -ty year -R0 sun -RT0 sun) is about twice as fast than when the restrictions are omitted, since we’re only looking at Sun locations.
-R0 [<obj1> ..]: Like -R but restrict everything first.
The -R0 option will cause all bodies to be restricted, which is useful if you are looking for just the transits/aspects of a few planets (e.g. -R0 6 7 will cause everything but Jupiter and Saturn to be ignored.) Combining all these methods can cause whatever you are looking for in transits and aspects to be quickly found without having to wade through lots of data you aren't interested in.
-R1 [<obj1> ..]: Like -R0 but unrestrict and show all objects.
This will unconditionally unrestrict all planets and other objects used by the program, which is a complement to the -R0 switch above which restricts everything. Note that this will also set modes, in that it does automatically activate the -C, -u, and -U sets of objects.
-R[C,u,U]: Restrict all minor cusps, all Uranians, or stars.
These three switches are similar to the -R0 option in that they initially restrict objects, i.e. all the minor cusps, Uranians, and fixed stars, respectively from appearing. For example, if you want to include only the star Sirius in a window chart without having to also include all the other stars (or having to enter a very long restriction list), do: “astrolog =RU Sir -X”, which will include restrict all stars except Sirius, before making the chart.
-RT[0,1,C,u,U] [..]: Restrict transiting planets in -t lists.
Transiting planets may be restricted from charts independently of those planets being transited to. In -T charts, the -R option only affects the natal planets. To restrict transiting planets, one must use the -RT option. The -RT option is exactly like -R, and any subswitches of -R can be used with -RT as long as the 'T' immediately follows the 'R'. For example, -RT by itself restricts transiting asteroids from appearing in -T charts, -RT0 restricts all transiting bodies, -RTu restricts the Uranians, and so on. This is a really useful feature, and allows one to pretty much be able to generate exactly and only those transits one is interested in. For example, if you want to see if anything is transiting your natal Jupiter or natal Saturn this month, do: “astrolog -i yourchart -T 3 1993 -R0 6 7”. If you want to see if Chiron is transiting anything this year (excluding asteroids), do: “astrolog -i yourchart -Ty 1993 -RT0 11 -R”. If you are only interested in transits of outer planets to your Sun or Moon, do: “astrolog -i yourchart -T 3 1993 -RT0 6 7 8 9 10 -R0 1 2”, and so on. By default, only the transiting Moon is restricted. To get it back, merely unrestrict it with “-RT 2”. These default transit restrictions are in the astrolog.as defaults file described later, and are right after the standard restriction table, both of which may be modified however you please.
-RA [<asp1> ..]: Restrict specific aspects from displays.
The -RA switch will restrict the given aspect or list of aspects from appearing in charts, like how the -R switch does for objects. (Note that aspect can also be restricted by giving it a negative orb.) Aspect restrictions are automatically linked with the -A switch aspect count setting. In other words, increasing the aspect count will automatically unrestrict uncovered aspects, and decreasing it will automatically restrict covered aspects. Also, manually restricting or unrestricting aspects will automatically adjust the aspect count to be the highest unrestricted aspect.
-RO <obj>: Require object to be present in aspects.
A “reverse restriction” is a required object that must be present in charts involving aspects between planets. For example, if you want to see only aspects or transits involving Mars (such as Mars Trine Venus, and Mars Trine Jupiter, but not Venus Trine Jupiter) then Mars is considered required. If the object parameter is -1, “None”, or the empty string, that will turn this option off and not have a required object. In addition to actual aspects, this setting will affect the aspect configurations included after the text mode aspect grid (-g0 switch). It will also affect the midpoints included in the midpoint list (-m switch), although it won’t restrict which aspects are displayed to those midpoints (-ma switch).
-C: Include angular and non-angular house cusps in charts.
This option must be indicated to include the 12 actual house cusps (i.e. Ascendant, et al) in the various chart options, such as the -g aspect grids, -t transit searches, the graphics wheel chart, etc. This option won't have any effect on certain charts where only physical bodies are shown (e.g. -Z, -S, -L) or where all house cusps are already indicated in the chart (e.g. -v, -w). The house cusps technically have actual object indexes like the planets, and are objects 22 through 33 in order (add 22 to a house to get its index). You can deal with and restrict these individually for transit and other charts, e.g. to turn on just the Ascendant and MC, do “-C -RC 22 31”. Cusp objects (along with Uranians and fixed stars below) are integrated with object restrictions. In other words, restricting all objects in a category will turn the category as a whole off, and unrestricting an object within a category will turn the category on. Concerning rulerships, each cusp object is set to “rule” the sign corresponding to it (e.g. Ascendant “rules” Aries) while each cusp “exalts in” the next sign after it of the same element (e.g. Ascendant “exalts in” Leo).
-u: Include transneptunian/Uranian bodies in charts.
Display the locations of the “Uranian” planets with the -u switch. Transneptunian or Uranian planets are an interesting subset of astrology which includes various objects alleged to be beyond Pluto. (Do: astrolog -u -HO to list the nine Uranian bodies.) Astrolog will include the zodiac positions of these planets if one includes this option, and will print their positions after the main planets, or include them in the other chart types.
Astrolog supports the position of Vulcan, a hypothetical planet located inside Mercury’s orbit. Vulcan is significant in esoteric astrology, and is computed according to the research of L.H. Weston. Vulcan is stored within the Uranian group of objects (which are also hypothetical planets). That means this switch will include Vulcan along with the actual Uranians. Computing Vulcan requires the Swiss Ephemeris routines to be active, and it will be placed at 0Aries otherwise. The orbital formula for Vulcan is defined in the file “seorbel.txt” in the Astrolog install directory, and like the larger ephemeris files that text file needs to be present in order for Vulcan to be computed.
-U: Include locations of fixed background stars in charts.
Astrolog has the ability to display the positions of 47 of the brightest and most important stars in the sky. To include these stars in a chart, use the -U “universe” option. The 43 brightest stars, i.e. all those with apparent magnitude values < 2.0 are included, in addition to four dimmer “stars” which are considered significant, i.e.: Polaris the North star, the Pleiades (specifically the star Pleione within it) star cluster (home of our extraterrestrial cousins), Zeta Reticuli (home of the Grey aliens), and the Andromeda (M31) Galaxy (closest galaxy to our own Milky Way, and home to various extraterrestrial hierarchies.) One bright star is called “Orion”, which is formally Alnilam, the middle star of Orion’s belt. Since stars are mostly fixed in the sky, they won’t change position in the -s sidereal zodiac, although they will slowly precess forward in the standard tropical zodiac. Stars will move slightly between geocentric and heliocentric positions, based on the parallax effect produced by Earth orbiting around the Sun. The -R restriction option can be used to determine which stars are actually included, although the -U option will enable them all at once. With on screen graphics, the stars are labeled by three letter abbreviations, and are colored according to their brightness: orange for stars brighter than (less than) magnitude 1.0, and dark red for the dimmer remaining stars with magnitudes greater than this value.
-U[z,l,n,b]: Order by azimuth, altitude, name, or brightness.
In the -v standard chart, -Z horizon chart, and in the -HO object list, where all the stars are printed sequentially, it can sometimes be confusing to locate the star you want among 42 others. The -U option can be modified to sort the stars in various ways. If one uses -Ub instead of just -U, the stars will be listed in order from brightest to dimmest. Doing -Un instead of -U will alphabetize the stars by name. -Ul will sort them by their altitude from highest in the sky to lowest, while -Uz will sort them by their zodiac position. Note that any star ordering will have no visible effect in X windows, and one must still use the default ordering when passing numbers to the -R option to restrict various stars.
-A <0-18>: Specify the number of aspects to use in charts.
If you like many aspects, or only desire the major ones, to be included in the aspect grids, specifying -A <number> will limit or extend the number of aspects (e.g. -A 2 will make charts with only conjunctions and oppositions listed in them, while -A 18 will include all 18 aspects that Astrolog supports.)
-A3: Aspects calculated by latitude combined with zodiac position.
3D aspects: Aspect calculations can take the latitude of the planet into account. In other words, the angle between two planets is based on the 3D great circle distance between them on the celestial sphere, and not just the 2D difference between their zodiac position longitudes.
For example, during a New Moon the Sun and Moon may be as much as 5 degrees different in latitude, which means that even when a New Moon is exact, the 3D aspect orb between them may be up to 5 degrees. (If the Sun and Moon are conjunct in both zodiac position and latitude, then a solar eclipse is taking place.) For bodies with latitudes that can be widely different from the ecliptic, such as Pluto, asteroids, and especially fixed stars, the difference is more pronounced. For example, a body at 0Leo and -30 latitude will be Square a body at 0Leo and +60 latitude, even though they’re both at the same longitude and would be considered Conjunct normally.
-Ap: Orb limits apply to latitude as well as zodiac position.
3D orbs: Most astrologers and astrology software only look at a planet’s zodiac longitude, and ignore any latitude, when determining whether an aspect is within orb. When 3D orbs are on, they will prevent an aspect from appearing if the 3D great circle distance between the pair of planets is out of orb. That means turning 3D orbs on may cause certain aspects to no longer be present, especially involving objects that can have very different latitudes, such as asteroids and fixed stars. For example, a Conjunction between two planets both exactly at 15Libra longitude won’t be flagged if their latitudes are different by more than the orb for the Conjunction aspect.
-Ao <aspect> <orb>: Specify maximum orb for an aspect.
Change the default orbs of the various aspects with the -Ao <aspect> <orb> switch. Do you not like the 7 degree orbs for conjunctions that are used by default? Given an aspect number and an orb value, the orb used for that particular aspect is updated accordingly. Non-integer orb values are allowed. Use negative orb values to completely eliminate an aspect from ever appearing. For example: astrolog -Ao 2 4 -Ao 4 -1 narrows the orb for Oppositions, and eliminates Trines, leaving all the other aspects at the default values. Note that for very wide orbs more than one aspect may apply for a particular angle, in which case the earlier or more fundamental aspect is chosen.
-Am <planet> <orb>: Specify maximum orb allowed to a planet.
Ability to explicitly specify maximum orbs that any aspect can make to a particular planet is supported with the -Am switch. This is used for objects like the North Node which require narrower orbs than what the aspects themselves normally allow. The -Am switch takes two parameters: the first to indicate the index of the object, and the second to indicate what the maximum orb allowed to it will be. By default, the only objects with restriction are the Node, Part of Fortune, Vertex, and fixed stars, which allow a 2 degree max orb to them. With this option, one can change these limits or impose restrictions for other planets too. Note all stars use the maximum orb given to the first star (object #43), and object indexes beyond the first star aren’t allowed for this switch. The astrolog.as settings file will read in these default planet orbs for all objects.
-Ad <planet> <orb>: Specify orb addition given to a planet.
Ability to widen an aspect orb for any planet is supported with the -Ad switch. This is used for objects like the Sun and Moon for which one might want wider orbs to them than what the aspects themselves allow. Like the -Am switch, this -Ad switch takes two parameters: the first to indicate the object, and the second to indicate how much wider orbs allowed to it will be. By default, the only objects which have orbs widened for them are the Sun and Moon, each of which adds one degree to the orb of any aspect to it. With this option, one can change these additions or allow other objects to have them, too. Note all stars use the orb addition given to the first star (object #43), and object indexes beyond the first star aren’t allowed for this switch. The astrolog.as file will also read in defaults for these orb additions for all planets. (Note that these object orb additions can be added to a negative orb for an aspect making it valid, so if you really want to restrict an aspect with -Ao, it should be a large enough negative value so that the sum of any additions between two objects won't make it go positive.)
-Aa <aspect> <angle>: Change the actual angle of an aspect.
This option is used to change the actual angle of a particular aspect. This is useful if one wants to search for some unusual angle not already available in Astrolog’s aspects or accessible through the -x harmonic charts. For example, if I want to know when any planet enters a 2.5 degree orb of any planet in my natal chart, I would do a transit search along with “-Aa 1 2.5”, where “1” is the index of the conjunction aspect, and “2.5” means the “conjunction” is now exact when any two objects are 2 degrees and 30 minutes apart.
Switches which affect how a chart is computed:
-b: Use ephemeris files for more accurate location computations.
Astrolog uses the accurate Swiss Ephemeris to compute the positions of objects. These include the planets, the Moon and its nodes and Lilith, Chiron and the asteroids, and the Uranians and Vulcan. Swiss Ephemeris is also used to compute fixed stars and house cusps. The Swiss Ephemeris (version 2.07.01) is a compressed version of NASA’s Jet Propulsion Laboratory (JPL) DE431 ephemeris, and reproduces it with 0.001 arc seconds precision.
The ephemeris files used by the Swiss Ephemeris cover 10,000 years. Three different files cover each date range, which are named “se*.se1”, in which “se” stands for “Swiss Ephemeris”. The files “sepl*.se1” cover the planets (“pl” stands for planets), the files “semo*.se1” cover the Moon (“mo” stands for Moon), and the files “seas*.se1” cover the asteroids and Chiron (“as” stands for asteroids). The last three digits in an ephemeris filename indicate the date range covered, which consists of six centuries starting with the number indicated, in which “_” means a positive year, and “m” means minus or negative years BC. Note since there is no year 0 (1 BCE/BC is followed by 1 CE/AD) negative ephemeris file ranges are offset by 1 year. The three files “se*_18.se1” cover the years 1800 through 2400 AD, which is good for most modern purposes and take up 2012K of space. These three files are included in the standard setup of Astrolog. For users who want to cover more years, the complete set of files is available online. The following is a list of the years covered by each ephemeris file:
Files seplm54.se1 / semom54.se1 / seasm54.se1 cover -5401 BC - -4801 BC.
Files seplm48.se1 / semom48.se1 / seasm48.se1 cover -4801 BC - -4201 BC.
Files seplm42.se1 / semom42.se1 / seasm42.se1 cover -4201 BC - -3601 BC.
Files seplm36.se1 / semom36.se1 / seasm36.se1 cover -3601 BC - -3001 BC.
Files seplm30.se1 / semom30.se1 / seasm30.se1 cover -3001 BC - -2401 BC.
Files seplm24.se1 / semom24.se1 / seasm24.se1 cover -2401 BC - -1801 BC.
Files seplm18.se1 / semom18.se1 / seasm18.se1 cover -1801 BC - -1201 BC.
Files seplm12.se1 / semom12.se1 / seasm12.se1 cover -1201 BC - -601 BC.
Files seplm06.se1 / semom06.se1 / seasm06.se1 cover -601 BC - -1 BC.
Files sepl_00.se1 / semo_00.se1 / seas_00.se1 cover -1 BC - 600 AD.
Files sepl_06.se1 / semo_06.se1 / seas_06.se1 cover 600 AD - 1200 AD.
Files sepl_12.se1 / semo_12.se1 / seas_12.se1 cover 1200 AD - 1800 AD.
Files sepl_18.se1 / semo_18.se1 / seas_18.se1 cover 1800 AD - 2400 AD. *
Files sepl_24.se1 / semo_24.se1 / seas_24.se1 cover 2400 AD - 3000 AD.
Files sepl_30.se1 / semo_30.se1 / seas_30.se1 cover 3000 AD - 3600 AD.
Files sepl_36.se1 / semo_36.se1 / seas_36.se1 cover 3600 AD - 4200 AD.
Files sepl_42.se1 / semo_42.se1 / seas_42.se1 cover 4200 AD - 4800 AD.
Files sepl_48.se1 / semo_48.se1 / seas_48.se1 cover 4800 AD - 5400 AD.
There is a flag to “Use ephemeris files” in the astrolog.as file, which when set will always use the Swiss Ephemeris routines and is the same as just including -b all the time, in which case -b will toggle them back off. There is a compile time option #define SWISS in the astrolog.h header file which can be commented out to disable the -b switch and the new formulas (although there’s little reason to ever want to do that, of course).
If a chart is cast for a date without the required ephemeris files, an error message will be displayed (only one error message per chart, to avoid a long string of errors when doing charts like transit searches and ephemeris tables). Then, the program will fall back to using a less accurate internal ephemeris and formulas by Steve Moshier. The Moshier ephemeris is based on the JPL DE404 ephemeris, which covers 6000 years (-3000 BCE/BC to 3000 CE/AD), and computes planets to within 0.1 arc seconds, and the Moon within 3 arc seconds. Note that the position of Chiron is only available for 3975 years at most, from Jan 1, 675 through Dec 31, 4649, regardless of ephemeris files available. That’s because outside those dates Chiron’s orbit becomes impossible to accurately determine, due to close encounters with Saturn. Attempting to cast a chart for Chiron outside of this range with Swiss Ephemeris will display an error and place it at 0Aries.
When Swiss Ephemeris is active, the program also uses it for calculating house cusps, including the Ascendant, Midheaven, and related variables. That changes the position of the Ascendant and house cusps by several arc seconds in most charts, in comparison to when Swiss Ephemeris is disabled. It’s a minor effect, since on average house cusps change 15 arc seconds every clock second, however the slight improvement in accuracy is still present.
-b0: Display locations and times to the nearest second.
The ability to display zodiac positions to the arc second is supported with the -b0 switch. Without this, positions are displayed only to the arc minute (which used to be all that was useful due to the lesser accuracy of older calculation methods). With the Swiss Ephemeris routines accurate to within an arc second, this switch will turn on the more precise display.
When this setting is on, the planet and house positions in the -w text wheel chart, and the sidebar positions in graphic wheel charts, will be to the nearest second. The -g text mode aspect and midpoint grids will have an extra row for the zodiac arc second of the orb or midpoint position. The -Z local space chart will display the altitude and azimuth to the nearest second, while the other three vector columns will be displayed with an extra digit of precision. The -S orbital position chart will have all five of its columns displayed to an extra four digits of precision. The -L0 astro-graph chart with latitude crossings will display the latitude crossing intersections to the nearest second. The -Zd switch rising and setting chart will display the zenith and nadir altitudes, and the horizon azimuths to the nearest second.
Finally the standard -v listing will display the zodiac positions and latitudes to the nearest second, and the velocity values will have an extra four digits of precision. Note however this doesn't leave room to the right anymore for the house cusp positions and element table normally shown. They will be left out for -b0, however when the -C switch is in effect, the house cusp positions will be displayed in their own separate rows, which normally isn't ever done since there’s always the list to the side. (One more thing is that -b0 combined with -v will display an extra column at the end showing the decan positions of each object, allowing viewing of each planet alongside its decan without having to actually change positions with the -3 switch.)
Also with this setting, all clock times will include seconds. Exact times in the -d Transits In Day search list, the -t Transit To Natal search list, and the -Zd Rising and Setting Times list will all be displayed to the second, instead of just to the minute. This will also affect the time and location values in chart header text.
-bs: Use less accurate Moshier formulas instead of Swiss Ephemeris.
When ephemeris files are unavailable, the Swiss Ephemeris automatically falls back to using a slightly less accurate internal ephemeris and formulas by Steve Moshier. The Moshier ephemeris is based on the JPL DE404 ephemeris, which covers 6000 years (-3000 BCE/BC to 3000 CE/AD), and computes planets to within 0.1 arc seconds, and the Moon within 3 arc seconds. The -bs switch will force Astrolog to use the Moshier ephemeris, even if the more accurate ephemeris files are available.
-bp: Use less accurate Placalc files instead of Swiss Ephemeris.
Older versions of Astrolog used the Placalc ephemeris, which is less accurate and covers fewer years then the Swiss Ephemeris. The older ephemeris is still available with this switch. There’s little reason for the average user to ever need or want to do this. The old ephemeris routines are still available for obscure situations such as comparing accuracy of different calculation methods, testing against previous version output with known positions, or a need to run Astrolog in limited disk space environments. (The Placalc ephemeris is 4.8 megabytes total or 57K per century, while Swiss Ephemeris is 37.1 megabytes or 344K per century.)
Placalc’s accuracy is about the same as Mark Pottenger’s “CCRS” routines, and those used in Nova (it even fixes some accuracy problems Nova has, in some of its earlier versions at least). Placalc’s integrated outer planet positions represent the standard of the Nautical Almanac, the international astronomical standard, as published in the Astronomical Almanac, for its computations as computed before 1984. (Since 1984 the standard has been the DE200 integrations by JPL.) The Sun’s position implements the Newcomb theory for all terms > 0.01", the positions of Mercury through Mars are done to all terms > 0.05", while “Brown’s improved lunar ephemeris” is used such that the Moon is within 3" of DE200. For the asteroids, at the conclusion of the integration process computing their files, the uncertainty error had reached 8.0E-11 AU after CPJV_29, and 4.9E-10 AU after CPJV_m2. Placalc’s fraction of second precision, is of course much more accurate when compared to the Matrix positions, which are only accurate to about one minute (and several degrees for Chiron, as well as the four asteroids) for the 20th century only. For example, at 1800 CE/AD, the Matrix positions for the outer planets are off by 2 degrees, and about 1 degree for 2100; by 1500 CE/AD, Matrix is off by 14 degrees for Pluto while Chiron is barely in the right hemisphere any more.
Placalc uses ephemeris files for some planets which must be in a directory specified at compile time or covered by one of the environment variables in order to be found. The advanced routines are valid based on how many of the ephemeris files one has. With all of them, the formulas will cover and deliver accurate positions for nearly 8500 years from -5260 BCE/BC through 3237 CE/AD. There are 95 ephemeris files total. Each file covers a range of 100,000 days, or about 273 years. Altogether they take up 4.8 megabytes of disk space, but each segment of 273 years only takes up 150K. For each time segment, there is an ephemeris file named “LRZ5_n” containing the positions of Jupiter through Pluto (at 80 day increments), a file “CHI_n” containing the positions of Chiron, and a file “CPJV_n” containing the positions of the four asteroids. The 'n' refers to the span of Julian Days covered by it (divided by 100000). For example, Julian Days 1,200,000 through 1,300,000 are in the files “LRZ5_12”, “CHI_12”, and “CPJV_12” (the 'm' character in some files refers to negative/minus Julian Days). You don't need all the files to use -bp, just those that cover the dates you want to use. If you try to use -bp with a date not covered by an available ephemeris file, a warning message will be printed and the Matrix positions will be used. (Only one error is displayed for each chart until control returns to the user, to prevent potentially numerous errors from tables involving multiple charts such as transit searches.) The files “LRZ5_24”, “CHI_24”, and “CPJV_24” cover the years 1859 through 2131 CE/AD, which is good for most modern purposes and only take up 150K of space. (These three files are included in the standard zip archive release file of Astrolog. For users who want to cover more years, the complete set of files is available online.) The following is a list of the precise dates covered by each ephemeris file:
Files LRZ5_m2 / CPJV_m2 / CHI_m2 cover Jun 6, -5260 BC - Mar 20, -4986 BC.
Files LRZ5_m1 / CPJV_m1 / CHI_m1 cover Mar 20, -4986 BC - Jan 1, -4712 BC.
Files LRZ5_0 / CPJV_0 / CHI_0 cover Jan 1, -4712 BC - Oct 14, -4439 BC.
Files LRZ5_1 / CPJV_1 / CHI_1 cover Oct 14, -4439 BC - Jul 28, -4165 BC.
Files LRZ5_2 / CPJV_2 / CHI_2 cover Jul 28, -4165 BC - May 10, -3891 BC.
Files LRZ5_3 / CPJV_3 / CHI_3 cover May 10, -3891 BC - Feb 21, -3617 BC.
Files LRZ5_4 / CPJV_4 / CHI_4 cover Feb 21, -3617 BC - Dec 4, -3344 BC.
Files LRZ5_5 / CPJV_5 / CHI_5 cover Dec 4, -3344 BC - Sep 17, -3070 BC.
Files LRZ5_6 / CPJV_6 / CHI_6 cover Sep 17, -3070 BC - Jun 30, -2796 BC.
Files LRZ5_7 / CPJV_7 / CHI_7 cover Jun 30, -2796 BC - Apr 13, -2522 BC.
Files LRZ5_8 / CPJV_8 / CHI_8 cover Apr 13, -2522 BC - Jan 25, -2248 BC.
Files LRZ5_9 / CPJV_9 / CHI_9 cover Jan 25, -2248 BC - Nov 7, -1975 BC.
Files LRZ5_10 / CPJV_10 / CHI_10 cover Nov 7, -1975 BC - Aug 21, -1701 BC.
Files LRZ5_11 / CPJV_11 / CHI_11 cover Aug 21, -1701 BC - Jun 3, -1427 BC.
Files LRZ5_12 / CPJV_12 / CHI_12 cover Jun 3, -1427 BC - Mar 17, -1153 BC.
Files LRZ5_13 / CPJV_13 / CHI_13 cover Mar 17, -1153 BC - Dec 28, -880 BC.
Files LRZ5_14 / CPJV_14 / CHI_14 cover Dec 28, -880 BC - Oct 11, -606 BC.
Files LRZ5_15 / CPJV_15 / CHI_15 cover Oct 11, -606 BC - Jul 24, -332 BC.
Files LRZ5_16 / CPJV_16 / CHI_16 cover Jul 24, -332 BC - May 7, -58 BC.
Files LRZ5_17 / CPJV_17 / CHI_17 cover May 7, -58 BC - Feb 18, 216 AD.
Files LRZ5_18 / CPJV_18 / CHI_18 cover Feb 18, 216 AD - Dec 1, 489 AD.
Files LRZ5_19 / CPJV_19 / CHI_19 cover Dec 1, 489 AD - Sep 14, 763 AD.
Files LRZ5_20 / CPJV_20 / CHI_20 cover Sep 14, 763 AD - Jun 27, 1037 AD.
Files LRZ5_21 / CPJV_21 / CHI_21 cover Jun 27, 1037 AD - Apr 10, 1311 AD.
Files LRZ5_22 / CPJV_22 / CHI_22 cover Apr 10, 1311 AD - Jan 31, 1585 AD.
Files LRZ5_23 / CPJV_23 / CHI_23 cover Jan 31, 1585 AD - Nov 16, 1858 AD.
Files LRZ5_24 / CPJV_24 / CHI_24 cover Nov 16, 1858 AD - Aug 31, 2132 AD. *
Files LRZ5_25 / CPJV_25 / CHI_25 cover Aug 31, 2132 AD - Jun 16, 2406 AD.
Files LRZ5_26 / CPJV_26 / CHI_26 cover Jun 16, 2406 AD - Mar 31, 2680 AD.
Files LRZ5_27 / CPJV_27 / CHI_27 cover Mar 31, 2680 AD - Jan 14, 2954 AD.
Files LRZ5_28 / CPJV_28 / CHI_28 cover Jan 14, 2954 AD - Oct 30, 3227 AD.
Files LRZ5_29 / CPJV_29 cover Oct 30, 3227 AD - Aug 15, 3501 AD.
Note that because the asteroid ephemeris files were first introduced in a version after those for the other planets, meaning one may not yet have CPJV_n files for dates they have the other files for, there is an “undocumented” switch called -ba, which is like -bp but will still compute the asteroids using the Matrix formulas.
Note that this calculation method is not compatible with allowing the -v0 switch to express planetary velocities relative to average speed work with it, and nor will central planetary bodies other than the Sun or Earth (standard Geo and Helio centric charts) via -h work. It will however display velocities for the Moon and the Nodes, which aren't available with the Matrix routines.
Special thanks to Dr. Alois Treindl who kindly allowed the Placalc formulas to be used in Astrolog. Mr. Treindl is the founder and owner of Astrodienst Zurich, second largest astrological computer service in Europe, and is well known for his work with Liz Greene. Astrolog basically treats the Placalc routines as a library which we link into, in that code that knows about both programs is kept to a minimum.
Special thanks also to Mr. Paul Schlyter, of the Swedish Amateur Astronomer’s Society (SAAF, or in Swedish: Svensk Amat|rAstronomisk F|rening), for providing ephemeris files for the four asteroids, by writing a utility which does the integration process to determine the positions, and that conveniently output files in the Placalc format. Note that the requirements for use of those asteroid files are the same as that of the rest of Astrolog.
-bm: Use inaccurate Matrix formulas when ephemeris unavailable.
If the Swiss Ephemeris and Placalc are disabled or not compiled in, then Astrolog will use a very old set of formulas that don’t include external ephemeris files, based on routines originally designed by Matrix Software. The old Matrix formulas are only accurate to about one arc minute for the 20th century. The Uranian objects are less accurate in the Matrix routines too. Their zodiac positions may vary up to 10 arc minutes, and their latitudes (which will always be fixed at 0) may vary by up to 59 arc minutes. This switch allows these formulas to still be used. When this setting is off, the Matrix formulas will never be used no matter what, in which case the lack of ephemeris files will result in planets being at 0Aries. That may be desired behavior, to ensure only the best Swiss Ephemeris positions are ever in place. Many may prefer the error condition of no positions, to relatively inaccurate and potentially misleading positions. There’s little reason for the average user to ever need or want to turn this on, although some features like defining your own orbital elements (via the -YE switch) make use of the simple Matrix formulas.
-bU: Use inaccurate Matrix formulas for fixed stars only.
The Swiss Ephemeris is also used for computing the positions of fixed stars. Star positions are taken from the file sefstars.txt that comes with Astrolog’s installation. Stars can be computed without Swiss Ephemeris with the -bU command switch. There’s little reason to not use Swiss Ephemeris, although fixed stars are computed slightly faster via the older and less accurate method.
-c <value>: Select a different system of house division. 0 = Placidus, 1 = Koch, 2 = Equal, 3 = Campanus, 4 = Meridian, 5 = Regiomontanus, 6 = Porphyry, 7 = Morinus, 8 = Topocentric, 9 = Alcabitius, 10 = Krusinski, 11 = Equal MC, 12 = Pullen S-Ratio, 13 = Pullen S-Delta, 14 = Whole, 15 = Vedic, 16 = Sripati, 17 = Horizon, 18 = APC, 19 = Carter Poli Equatorial, 20 = Null.
21 different house systems are supported in the program: Invoke as astrolog -c <number> to change the system from the default of Placidus. Note that in the Campanus, Regiomontanus, and Topocentric house systems, at high latitudes their houses are sometimes arranged in reverse order. Also note that the Placidus and Koch systems aren't defined for polar locations inside the Arctic and Antarctic circles. If the user attempts to cast a chart using them with a latitude beyond about 66 degrees N or S, the program will display a warning, and then fall back to Porphyry houses. Similarly, most house systems are still defined at extreme latitudes (inside the Arctic or Antarctic circles) but have the condition where the natural formulas for the MC and Asc at those locations would put the Asc in the 180 degrees before instead of after the MC. In such a case Astrolog preserves the Midheaven, and flips the Ascendant if need be to ensure the other house cusps will remain sane.
House system number 11 is the Midheaven based Equal house system. This is just like the more common standard Equal house system (-c 2) except that we start with the 10th cusp being the same as the MC and disassociate the 1st cusp from the Ascendant, instead of starting with the 1st cusp being the same as the Ascendant and disassociating the 10th cusp from the MC.
House indexes 12 and 13 are the Pullen sinusoidal systems of house division. They are relatively new systems similar to Porphyry houses, except they’re “smooth” around the zodiac with the MC/Asc ratio or difference being spread in a continuous sinusoidal manner from expanded to compressed quadrants. For more information about these systems and why they can be considered the “best looking” house systems for wheel charts, see: http://www.astrolog.org/astrolog/astsine.htm.
House index 14 is the Whole system of houses, where the first cusp is at zero degrees of the sign of the Ascendant, and the others are all at the beginning of the succeeding signs. This is basically the same as the Equal system with all positions shifted back to the start of their sign. Thanks to Andy Gray for telling me about this system and how it’s computed.
House index 15 is the Vedic system of houses, or more specifically the modern India style of Equal houses. In this system, each house covers 30 degrees, and the Ascendant is always in the middle of the first house, i.e. the 1st cusp is always 15 degrees before the Ascendant. (For contrast, the ancient or traditional India style of equal houses are already supported in Astrolog by the Whole house system above, where the first house cusp is always the start of the sign the Ascendant is in.)
House index 16 is the Sripati system of houses. This house system is a mixture between the Vedic and Porphyry systems. It’s computed the same as Porphyry, except that each cusp starts in the middle of the previous house as defined by the Porphyry system.
House index 17 is the Horizon system of houses. Sometimes called “Azimuth”, this system has the 10th cusp the same as the MC, however it disassociates the 1st cusp from the Ascendant. (Meridian houses has this property too.)
House index 18 is APC system of houses. More fully called “Ascendant Parallel Circle”, this is a quadrant based system, however it has the interesting property that non-angular cusps aren’t always 180 degrees opposite each other.
House index 19 is the Carter Poli Equatorial system of houses. Invented by astrologer Charles Carter (1887-1968), this system has the 1st cusp the same as the Ascendant, however it disassociates the 10th cusp from the MC.
House system 20 is Null houses, also called Aries houses. It refers to no houses at all, or in other words where the Ascendant will always be 0 degrees Aries, the Nadir 0 degrees Cancer, etc, which can be useful for extended chart animations, in which having houses at all can tend to get in the way. One can even observe the precession of the equinoxes with this system if used in conjunction with the -s sidereal chart option.
-c3: Place in houses using latitude as well as zodiac position.
Astrolog supports 3D houses, which means that a planet’s house placement is determined by its ecliptic latitude in addition to its zodiac longitude. 3D houses is not a standard house system, since it doesn’t affect Astrolog’s list of house cusp objects (which are still determined by whatever house system is active). However, 3D houses does determine which house an object is placed within.
In general, houses are based on the local horizon, in which the sky or celestial sphere is divided into 12 equally sized "orange wedges", with houses 1-6 below the horizon, and houses 7-12 above it. Similarly, houses 10-3 are to the east of the meridian, and houses 4-9 are to the west of the meridian. The signs of the zodiac are also a set of 12 "orange wedges", however they're oriented to a different coordinate system, or more specifically are rotated to be aligned with the ecliptic.
Campanus is the standard house system most similar to 3D houses, because Campanus houses are defined by the intersection of the ecliptic with the 12 house "orange wedges". That means Campanus houses and 3D houses give the same house placements for planets exactly on the ecliptic. Since most planets are near the ecliptic, and it's only objects like asteroids and especially stars that are located any significant distance from it, Campanus is a rough approximation of 3D houses. Therefore, Campanus is probably the best house system to use with the 3D houses setting, since it ensures each house cusp object is placed in the right 3D house.
When 3D houses are active, it affects charts in the following ways:
Standard list (-v switch): The indicating of what house a planet is within is based on 3D houses, and not the house cusp positions of whatever house system is active.
Graphic wheel (-v -X switches): The positioning of planets around the wheel is based on its proportion through the house, and not its zodiac position. Normally the wheel is “zodiac focused” and a planet is placed based on its zodiac longitude, with its latitude (and how latitude affects 3D house placement) ignored. When 3D houses are on, the wheel is instead “house focused”. That means positioning is based on the proportion a planet is through its house, e.g. a planet 1/5 of the way through the 3rd house will be positioned 1/5 of the way through the 3rd house in the wheel, regardless of the planet’s zodiac longitude. The result is planets seem to shift slightly, especially if their latitude is different from 0.
Text local horizon (-Z switch): Positions will be displayed in prime vertical mode (as with the -Z0 switch), because prime vertical coordinates define houses, in which the azimuth or 0-360 degrees (representing house positions 1-12) follows the prime vertical from the horizon east point through the west point via the nadir. Similarly, the altitude or -90 to +90 degrees ranges from the north to south points on the local horizon. In addition, instead of a 0-360 degree number, the azimuth will be expressed as the house position 1-12, along with the percentage the object is through the house from 0-30 degrees.
Graphic local horizon (-Z -X switches): Both versions of the graphic local horizon chart will have added to it an overlay of dark green lines showing the 3D houses (with each house labeled 1-12), and dark blue lines showing the signs (with each sign labeled with its glyph). These two sets of overlapping “orange wedges” can make it clear how 3D houses differ from house determination by zodiac longitude only.
Graphic solar system orbit (-S -X switches): Planets will be drawn on a logarithmic scale, resulting in planetary orbits roughly equally spaced. One issue with the normal chart is that unless one is really zoomed in, the inner planets are crammed together and harder to see.
Chart sphere (-XX switch): As with the graphic local horizon chart, this chart has the ability to highlight house boundaries in 3D as well as 2D. 2D house boundaries share the same “poles” as the zodiac itself, and the size of each house’s “orange wedge” will be determined by the house system in effect. In contrast, 3D house boundaries are anchored to the North and South points on the local horizon, and are always equal sized “orange wedges”. Toggling the 3D houses setting while viewing the display is an easy way to visualize the difference between 2D and 3D houses. Showing 2D or 3D houses assumes that houses boundaries are being shown in the first place, which is toggled by the show house details setting (-XC switch).
Graphic globe (-XG switch): When “Modify Display” setting is active (-Xi switch) which causes the planets to be drawn over the globe at their zenith positions, the globe will have an overlay in dark green lines showing the ecliptic and sign wedges. This applies to both the globe showing the Earth’s continents (which looks “down”) and the celestial sphere showing the astronomical constellations (which looks “up”).
-s [..]: Compute a sidereal instead of standard tropical chart.
With this option, the chart will be just like the normal charts as most commonly used in Western astrology, except that all the zodiac positions will be shifted (to be about 24 degrees earlier). This is because the option casts sidereal charts which are based on the positions of the fixed stars (i.e. Aries starts at the constellation Aries) rather than the seasons (i.e. Aries starts at the Spring or Vernal Equinox.) Due to the “precession of the equinoxes” the position of the Sun at the Equinoxes has been gradually happening at an earlier point in the sidereal zodiac each year (taking about 2147 years to change signs.) Note that in the sidereal zodiac, planet velocities are slightly lower, to align with the fact that sidereal zodiac positions are all precessing backwards very slowly.
This switch accepts an optional parameter of an offset for the start of the zodiac. This value, when non-zero, will be added to all zodiac positions, and effectively allows one to choose any starting point for the sidereal (or tropical) zodiac, which is useful for Hindu or other systems whose sidereal zodiacs have zero Aries at a different location than the standard Fagan-Bradley sidereal zodiac the program uses by default. For example, “-s 10.5” will add 10 degrees and 30 minutes to all zodiac positions. This value is initialized to a zodiac offset value setting in the astrolog.as initialization file, which is by default zero.
-sr: Compute right ascension locations relative to equator.
This will display planetary positions relative to the Earth’s equator instead of the ecliptic i.e. Earth’s orbit. This is the way more commonly used in astronomy, and results in real right ascension notation, especially when combined with the -s sidereal zodiac and -sh hours and minutes display format. This switch makes the declination values in the standard -v listing also relative to the equator, instead of the ecliptic latitude displayed by default, where “Declination” will be printed at the head of the column instead of “Latitude”. (Without this the only way to get such information is from the zenith latitudes in the -L astro-graph chart which show the same thing.) Note that this setting isn't fully integrated with all of Astrolog’s charts; specifically it will distort the values in the -Z local horizon, -S orbit, and -L astro-graph charts which assume ecliptic positions, and hence -sr shouldn't be combined with these options.
-s[z,h,d]: Display locations as in zodiac, hours/minutes, or degrees.
For astronomers out there, the -sh switch will express all planetary positions in the right ascension hours/minutes format instead of the sign/degrees/minutes astrologers are accustomed to. This will affect how the objects are listed in most charts, such as the -v position list, the -E text ephemeris, and how star azimuths are displayed in the -HO list. For example, 0 degrees Aries is represented as 0 hr, 0 min; 0 Cancer goes to 6 hr, 0 min, and so on through the 24 hour clock.
The -sd switch will cause zodiac positions to be displayed as a simple decimal degree number in the 360 degree circle. This setting will also apply to longitude and latitude values in charts, including the standard -v text chart listing and graphic wheel chart, and the -E text mode ephemeris when listing latitudes. To return to the default of displaying as degrees and minutes within a zodiac sign, use the -sz switch.
-h [<objnum>]: Compute positions centered on specified object.
Standard astrology charts are based on the positions of the planets relative to the Earth. However, this option allows seeing of the zodiac positions with respect to the Sun’s (or any other planet’s) point of view. The -h option when invoked by itself will display a heliocentric chart: the Sun in the original listing will be replaced with the Earth’s position as seen from the Sun in the heliocentric chart, with the other planets' positions modified accordingly. For bodies other than the Sun, this option takes a parameter to indicate which planet to center the chart on, e.g. do -h 5 to cast a Mars centered chart. (Even Moon centered charts are allowed, however note that when the -b ephemeris setting is off, the -h option won't ever affect the Moon, which will always be displayed as seen from the Earth, no matter what the center body is set to, since it’s not a formal planet.) Note also that the Earth has its own object index, which is position number zero, meaning 0 is a valid value to pass to switches that take an object like -R. Charts such as the local horizon chart which don't include the central planet, will automatically leave it out even if that planet is unrestricted.
-p <month> <day> <year>: Cast 2ndary progressed chart for date.
A secondary progression chart for a particular date can be cast using the '-p <month> <date> <year>' command switch. The precise time within the given day progressed to is midnight in the default time zone. House cusps are progressed using the quotidian method, which means cusps move about 360 degrees each year in the progressed chart, because they move about 360 degrees each day in a standard chart.
This setting to progress charts may be turned off by invoking the -p switch as “_p” with the underscore reset prefix. Unlike the standard -p switch, _p takes no parameters. This is a command switch trick only useful when doing multiple charts in a -Q loop, or when passing extra command lines to a graphics screen with the return key or through macros.
-p0 <month> <day> <year>: Cast solar arc chart for date.
Solar arc progressions are supported in addition to secondaries. Invoke the -p <month> <day> <year> switch as -p0 instead, and a chart will be generated with all planets and house cusps progressed forward an amount equal in degrees to the number of years that have passed between the specified date and the chart in question. The -pd option here (see below) specifies the number of days that have to pass per zodiac degree to progress forward; by default this is 365.24219. To generate a solar arc chart for the current moment now, invoke the -pn switch as -p0n.
-p[0]t <month> <day> <year> <time>: Like -p but specify time too.
The -pt switch is just like -p, except in addition to month/day/year parameters for the date to progress to, it also takes a fourth parameter for the time within the date. Progressed charts usually move so slowly that one doesn’t care about time, but time can be specified for extra precision.
-p[0]n: Cast progressed chart based on current date now.
The -pn switch is like the -p <month> <date> <year> switch except that (like the -n switch) it assumes the current moment now to cast the progressed chart to. This is just another shorthand convenience to see what ones progressed chart is like presently; just do: astrolog -i file -pn.
-pd <days>: Set no. of days to progress / day (default 365.24219).
User definable progression rates can be specified with this option. When using the -p progression option, Astrolog assumes you want the standard “year for a day” rate of progressions. By passing different values to the -pd switch, one can change the default “365.24219 days for a day” to any value they want for some less often used method of progression. For example, one can do “-pd 7 -pn” to do a week for a day, “-pd -365.24219 -pn” to get negative year for day progressions, and so on. For tertiary progressions, do “-pd 29.530588”. (Note that “-pd 1 -p...” would be the same as if no progression were done at all.)
-x <value>: Cast harmonic chart based on specified factor.
Harmonic charts (i.e. where all the planet positions are multiplied by a factor and the chart recast) are supported via the “-x” option (e.g. “-x 3” will make all trines conjunct in the chart displayed.) The parameter passed in may be any number, including decimal or negative numbers, ranging anywhere from 1 (i.e. no harmonic factor) to 30000 for those who want to explore extreme harmonics.
-1 [<objnum>]: Cast chart with specified object on Ascendant.
The -1 <obj> option can be used to change the houses to force a particular object to be on the ascendant. This is useful in casting Solar charts or for when the time of birth is not exactly known. For example -1 2 will cast a normal chart, but the house cusps will be rotated so that the moon is on the ascendant.
If the -1 switch is invoked as -10, then instead of rotating house cusps so that the Ascendant is the same as the Sun, it will rotate house cusps so that the Ascendant is the same as the start of the Sun’s sign. Similarly, the -20 switch acts like the -2 switch below, and does the same for the Midheaven.
-2 [<objnum>]: Cast chart with specified object on Midheaven.
Just as the -1 option is used to cast a chart with an object on the Ascendant, the -2 <object> switch will cast a chart with the specified object on the Midheaven. The house cusps will be rotated so that the object in question is conjunct the 10th house cusp. As with the -1 option, if <object> is not specified, the Sun will be assumed by default.
-3: Display objects in their zodiac decan positions.
Decan displays are supported in Astrolog, and one can display a decan influenced chart with the -3 switch. The decan theory is that each sign in the zodiac can be divided into three parts: The first 10 degrees (i.e. the first decan) is mainly influenced by the sign in question, the second 10 degrees (second decan) although still influenced by the sign in question is also somewhat influenced by the next sign of the same element, while the last decan is influenced by the third sign of the same element. The -3 switch applied to a chart will move each object into the sign of its decan. For example, if the Sun is at 29 degrees Aquarius and the Moon at 5 degrees Virgo, in the resulting chart, the Sun will go to Libra (26 degrees) and the Moon will remain in Virgo (although be at 15 degrees now since it was previously in the middle of the first decan of Virgo.)
-4 [<nest>]: Display objects in their (nested) dwad positions.
Turn on a dwad transformation of planet positions with this switch. Dwads divide each sign into 12 subsigns, similar to the 12th harmonic, however unlike simple harmonics each subsequence starts with the current sign. Dwads can be nested multiple levels deep, similar to a fractal: This switch takes an optional parameter indicating how many nestings to apply.
-f: Display houses as sign positions (flip them).
The -f option can be used to “flip” the signs and houses, i.e. display the house as a sign position and vice versa. For example having the Sun at 26 degrees Scorpio, 2/3 way though the 10th house, will cause the resulting Sun under the -f option to be at 20 degrees Capricorn, 26/30th the way through the 8th house. This can be used to determine how far a planet is through a particular house, as well as for domal chart analysis that Mark Kenski has informed me about. Domal analysis is based on the fact that for synastry comparisons, for example, a planet in Gemini and one in the 3rd house can be considered related in a way similar to a conjunction.
-G: Display houses based on geographic location only.
This switch generates a special type of locational analysis chart, called a geodetic chart, in which the house cusps are computed from a different source, i.e. as a function of only the longitude and latitude. This basically gives every spot on the planet a different unique set of house cusps, and can be used to analyze the characteristics of different areas, and their influence on you if you insert your own planets in the houses. This type of chart was described in the January 1992 issue of Dell Horoscope magazine, from which I learned how to generate these charts. Basically, the Midheaven is approximately the longitude value converted from degrees into the appropriate zodiac sign; for example 0 degrees E goes to 0 degrees Aries, 30 degrees E goes to 0 degrees Taurus, etc.
-J: Display wheel charts in Vedic format.
Astrolog can display wheel charts in Hindu or Vedic format. This will affect both the text -w wheels and the graphic wheels. A Vedic format wheel is identical to a standard Western wheel except: (1) The signs and houses increase as you go clockwise instead of counterclockwise, so the entire wheel is flipped over. (2) The chart is rotated so the left edge is always the start of Aquarius instead of the Ascendant, putting Pisces in the upper left corner, meaning the Ascendant is placed wherever in the wheel is appropriate. For Vedic astrology one will probably prefer to combine this with the -w house focused wheel chart switch so all the houses are the same size, or even display that chart in text mode so the wheel will be a square.
-9: Display objects in their zodiac navamsa positions.
This command switch will display the chart in the navamsa format used in Vedic astrology. The navamsa or marriage chart is formed by applying a formula to each planet position to get a resulting new location. This is similar in operation to the -3 decan feature, however this divides each sign into ninths. Specifically, to convert a position, see which ninth of a sign a planet falls in, e.g. a planet from 0 degrees 0' to 3 degrees 20' of a sign is in the first ninth, a planet from 3 degrees 20' to 6 degrees 40' is in the second ninth, and so on. Take that number, and count one less than that many signs ahead in the zodiac to get the resulting sign. The starting sign should be Aries if the original sign was Fire, Capricorn if the original sign was Earth, Libra if the original sign was Air, and Cancer if the original sign was Water. A formal navamsa chart only considers signs, hence only the sign of each planet will be changed, and the degree within each sign will be unaffected.
-F <objnum> <sign> <deg>: Force object’s position to be value.
The -F option is used to force a particular object’s position to always be a particular location in the zodiac. This feature can be used as an easy way to manually include things Astrolog normally doesn't in various charts. For example, this can be used to force the position of some minor thing, like the Vertex, to always be the location of whatever you prefer, like the 0 degrees Aries point, or an important midpoint. Then you can do an aspect grid, transit search, or whatever, and calculate aspects to midpoints or transits over midpoints. The -F switch takes three arguments: first is the index of the object to replace, next is the sign from 1..12 to force it to be, and third is the degree within the sign. For example, if I want to see if anything is making an exact aspect today with my Sun Moon midpoint at 6Sag28, I could do “astrolog -n -d -F 16 9 6.28”, which would replace the North Node with my Sun Moon midpoint in the aspect search.
-Fm <objnum> <obj1> <obj2>: Force object's position to midpoint.
The -Fm option will force an object’s position to always be the midpoint between two other objects. Note all -F switch forcings are applied in object index order, so it’s possible to have midpoints involving other midpoints, as long as the more complex midpoints have higher indexes.
-+ [<days>]: Cast chart for specified no. of days in the future.
The -+ <#ofdays> option will cast a normal chart, but one for #ofdays in the future (or past if a negative value is given). One use for this is in combination with the -n and -d options. For instance, I often invoke the program as “astrolog -n -d” to see the exact times of today’s aspects. However, just before midnight I might want to see what’s going to happen in the following day, so I would do “astrolog -n -d -+ 1” to see the exact times for tomorrow’s aspects. The #ofdays parameter is optional, and will default to one if left off, so the above command can be done as just “astrolog -n -d -+”.
Note that for such a chart, the chart header will show the correct date of the actual new chart, instead of the original one. For example, today (11-19), if I do “astrolog -n -+ 2” I will get the chart for two days from now, and the chart header will display 11-21. This has some special uses. For example, if you want to know what the date was/will be when you are 10000 days old, do “astrolog -i yourchart -+ 10000” and see what the date in the resulting chart header is.
-- [<days>]: Cast chart for specified no. of days in the past.
This “dash minus” option is just like the “dash plus” (-+) option described above, except it subtracts instead of adds the specified number of days from any chart cast. This is only for convenience, in that “-- 1” is the same as “-+ -1”.
-+[m,y] [<value>]: Cast chart for no. of months/years in future.
The -+m switch is just like the -+ switch above except that it will add one month (30 days) to whatever chart instead of one day. The -+y switch will add one year (365 days) to whatever chart. The -- “dash minus” switch is extended in a similar manner, in that --m and --y will do as expected. These switches also have the optional parameter to specify how many months or years to move forward or back.
Switches for relationship and comparison charts:
-r <file1> <file2>: Compute a relationship synastry chart.
Computing the relationship between two charts is supported. Invoke the program as 'astrolog -r <file_of_person1> <file_of_person2>' and the program will give you the relationship between the two charts. In other words, the program will use the positions of person2’s planets and person1’s houses. Use this with the -w option to get a wheel chart and you can do synastry. Note that transits can be computed with this by comparing your chart with the positions of the planets at the current moment (as in -n switch). To make this easier, you may specify the filename “now” for any file and the computer will use the current planet positions instead of looking for a like named file. (e.g. 'astrolog -r me now' will compute transits for file 'me'.)
Note: if the -r switch is invoked as “_r” with the underscore reset prefix, whatever relationship mode will be canceled. Unlike the standard -r switches, _r takes no file parameters. This is a command switch trick only useful when doing multiple charts in a -Q loop, or when passing extra command lines to a graphics screen with the return key or through macros. Astrolog’s -r relationship chart switches set relationship chart mode, and without this there’s no easy way to return to single chart mode. Yes, when a graphics screen is up, the 'c' key will toggle relationship comparison mode, but that’s not available from the command line.
-rc <file1> <file2>: Compute a composite chart.
The '-r' option can be used to generate composite relationship charts. Simply invoke it as '-rc <person1> <person2>' instead of just -r and a composite chart (i.e. composed of the midpoints of the planets, etc. of the two charts in question) will be generated. (Note: when the house cusps in the two charts are nearly 180 degrees apart, simply taking the midpoints of all the cusps may result in them being out of order in the resulting composite. In such a case we give priority to the composite midheaven, and invert the midpoints of any of the other cusps or the Ascendant by 180 degrees if leaving them that way would have things out of order.)
-rm <file1> <file2>: Compute a time space midpoint chart.
Time-space midpoint relationship charts are supported: Doing “-rm chart1 chart2” will calculate the time and location exactly half way between the times and locations as indicated in the two files. Unlike all other types of relationship charts, this one actually exists in space and time, and therefore can be treated like a single chart and can be output to a file with the -o option.
-r[c,m]0 <file1> <file2> <ratio1> <ratio2>: Weighted chart.
The -rc composite and -rm time-space midpoint relationship charts may be weighted to give more influence to one of the charts. When the switches are invoked as -rc0 or -rm0 they accept two additional parameters which are the ratio weights to give to the two chart files in question. For example, the sequence “-rm person1 person2 2 1” will still do a time space midpoint chart, but the time and location that the chart is cast for will be biased at a 2:1 ratio toward person1, i.e. will be 2/3 of the way from person2’s chart info closer to person1’s info.
Note that the -rc0 switch can be used to generate multiple composite charts between more than two people! A composite chart between two people can already be done and saved to a file with “-rc person1 person2 -o0 composite12”. A third person can now be merged in by doing a composite between it and the composite of the first two, but giving the first result a 2:1 ratio because two charts have already gone into it, by “-rc0 composite12 person3 2 1 -o0 composite123”. A fourth person can then be merged in at a higher ratio with “-rc0 composite123 person4 3 1 -o0 composite1234” and so on. Actually this method won't always generate a 100% correct multiple composite chart in cases where the objects are spread out over 180 degrees and the initial composites put the current midpoint in the wrong half, e.g. if the Suns of person1 through person3 are 1Can, 29Sag, and 0Ari, then the true composite Sun is at 0Ari, but composite12 is at 0Lib and hence the final composite is at 0Leo or 0Sag, in the wrong “quadrant” biased toward the earlier results. Still the results are useful and the method can be used with -rm0 to get the correct average between multiple chart locations.
-rd <file1> <file2>: Print time span between files' dates.
One useful non-astrological function in the program is the ability to determine how much time has passed between two dates, with the -rd switch. As with the -rb option below, this is considered a relationship “chart” because it requires the input of two different dates, and when -rd is in effect, again the standard -v planet position listing will be replaced by a line telling how much time has passed in the interval. The time difference is expressed in seven ways: in years, months, weeks, hours, minutes, and seconds (displayed to two decimal places). Also, the difference in location between the two charts is included. The degree differences between longitude and latitude are shown, as is the actual distance between the two spots on the globe when measured around a great circle (displayed to the degree, as well as in miles or kilometers based on whether the European length format is active). For example, “-rd person1 person2”, will display how many years, days, etc person1 is older than person2 (or the other day around). Want to say know how many years older your mother is than you? Just do “-rd momchart yourchart”. Want to find out how many days old you will be on Jan. 1, 2020? Do “-rd yourchart tty”, and type in the first date of the next decade, and see what you get!
-rb <file1> <file2>: Display biorhythm for file1 at time file2.
Biorhythm charts are supported by Astrolog with the -rb switch. Although not directly related to Astrology, the concepts are similar, and adding this didn't require much extra code, and since some are interested in this, I felt I'd add it in. The biorhythm theory says that we have three main types of energy: Physical, Emotional, and Intellectual. These three run in continuous wave cycles from high to low, each of which repeats about every 30 days or so. Therefore, a biorhythm chart for a particular day should describe how much energy one has or how they are feeling in this area. Now, Astrolog considers biorhythm charts as a type of relationship chart, because in order to generate one, two dates or charts are needed: the birth date of the person, and the date to cast their chart for. Technically the program will replace the standard -v listing of planet positions with the biorhythm chart when -rb is in effect. As an example, “-rb file1 file2” will cast the chart for the birthday signified by chart1 or chart2 (whichever is older) for the date in the other file. Remember that one can substitute the pseudo filename 'tty' to mean get the chart info from the terminal instead.
The actual biorhythm chart itself will display, for the day in question, what the percentages of the physical, emotional, and intellectual cycles are, as numbers from -100% (low ebb) to +100% (happy and full of energy). In addition, the biorhythm percentages for the seven days before (T-7 days) and the seven days after (T+7 days) the date in question will be listed, too, so one can see if the cycles are rising or falling. Finally, as a cute way to help in interpretation, the program prints the appropriate smiley, medium, or sad face after each percentage. (BTW, it takes over 58 years for all three cycles together to synchronize and repeat themselves.)
-r0 <file1> <file2>: Keep the charts separate in comparison.
There is a distinction between any of the above types of particular relationship charts and the actual comparison between two separate charts. The -r0 option is used to generate actual comparison charts. For example, combining -r0 with the -g switch will cause a full grid chart of the aspects between all the planets of the two charts (with person1’s planets on the vertical axis and person2’s on the horizontal) to be displayed. (Unfortunately, if all 20 of the default objects are left unrestricted here, the grid will exceed 80 columns, unless the -Y8 80 column clip feature is turned on.) The -r0 option can also be used with the -X switch to generate true relationship bi-wheel charts. The -r0 option will act like the -r synastry option for those displays which can't compare two charts. (Note the “-y file” current transit option is basically a shorthand way of doing “-r0 file now”.)
Comparison relationship charts may be generated for the standard -v text listing. This is the text mode version of a bi, tri, or quad wheel chart, and is displayed with the -v -r0 switch combination. The two to four charts covered will each have of their planet positions (both zodiac position and latitude) listed side by side. Also included is a delta, listing the distance between each pair of planets, or the maximum distance between any two planets in the case of tri and quad charts. This delta distance is the difference between zodiac positions (unless the 3D aspects setting is active, in which case it will be the great circle distance taking latitude into account too).
Comparison relationship charts may also be generated for the -m midpoint and -a aspect list options. Combining -m with -r0 will yield an ordered list of all midpoints between all combinations of one planet from chart1 and another planet from chart2. Combining -a with -r0 will yield a list of all aspects between planets in the two charts, in order based on what Astrolog think their influences are. So, if you really want to know if your Sun widely trining your partner’s Moon, will override the effect of your Saturn closely squaring their Mars, do “astrolog -r0 yourchart theirchart -a” and see the influence given to each aspect.
-rp[0] <file1> <file2>: Like -r0 but do file1 progr. to file2.
This switch is a form of the -r0 relationship comparison charts. This switch, given two files, will compare the natal chart in file1, to the chart of this natal chart progressed to the time specified in file2. This is a shorthand way to the commonly desired comparison of a progressed chart to a natal one. The -y switch may be invoked as -yp <file> which will automatically compare the chart to the current time now. For example, to get a dual graphic wheel chart with your natal planets in the inner wheel, and your current progressed chart on the outer wheel, simply do “-yp yourchart now -X”. (There is no easy way to do this otherwise, short of using -o0 position files, since the -p progression switch will affect all charts.) The -rp switch may also be invoked as -rp0, which will do the same thing but as a solar arc progression instead of a secondary progression.
-rt <file1> <file2>: Like -r0 but treat file2 as transiting.
The -rt switch will behave exactly like the existing -r0 chart comparison option but with a difference: transit restrictions will affect the second chart. With -r0, both charts are treated as natal charts and hence the normal -R restrictions apply to both. However, one may want to have different sets of planets active in the two charts, such as in a wheel chart where transiting planets are being compared to natal. Another difference with this transit and natal comparison relationship chart is that it sets the velocity for all natal planets to 0, so aspects show whether transits to natal planes are applying or separating correctly.
The -y switch which is like the -r0 switch but assumes the current moment now for the second chart, may be done as -yt in the same way. For example, to do a graphic bi-wheel showing your complete natal chart in the inner wheel, and only the current transiting outer planets on the outer wheel, do “astrolog -yt yourchart -X -RT0 jup sat ura nep plu”.
-r[3,4]: Make graphics wheel chart tri-wheel or quad-wheel.
Astrolog can do tri-wheel and quad-wheel graphics charts. These are like the standard and bi-wheel charts, but with a third and/or fourth ring of planets. The standard or first chart in memory is placed on the outer wheel, next in is the second chart in memory, where the third and/or fourth charts are on the inside. (Note this is different from the bi-wheel graphic which has the first chart on the inside and the second on the outside.) The house cusps and the graphic sidebar if showing will correspond to the info in the first ring. Lines in the middle of the chart will show aspects between planets in any two different pairs of charts present. In other words, a bi-wheel shows aspects between chart #1 and chart #2, and a tri-wheel shows aspects between chart #1 and #2, #1 and #3, and #2 and #3. When the -Xi alternate chart display flag is set, the program will draw dotted lines from each planet in the outer rings to the inner one, as is always done in the bi-wheel chart. The -r3 switch, taking no parameters, puts one in tri-wheel mode, and the -r4 switch puts on in quad-wheel mode. (You can also do -r2 to enter bi-wheel mode, and -r1 or _r to return to the standard single wheel.) These charts will highlight the space between the different planet rings with dark green circles. (This color can be customized, or set to black to remove the highlighting altogether.)
-y <file>: Display current house transits for particular chart.
The command switch '-y <file>' can be used as a shortcut way to compute the current transits for the chart in <file> (unless the TIME features are compiled out), which saves you from having to mention the “now” in the -r0 option.
-y[b,d,p,t] <file>: Like -r0 but compare to current time now.
The -y option is extended based on the -rb and -rd features. The -yb <file> switch will display the person indicated in file’s biorhythm for today. The -yd <file> switch will display how many months, days, etc old the person in the file is right now. Want to know how many minutes old you are? Just do “-yd yourchart”. Do the same command again right away and see that you are now a couple seconds older than the first time! There are also switches -yp[0] and -yt which similarly behave like -rp[0] and -rt above but automatically compare to now.
Switches to access graphics options:
-k: Display text charts using Ansi characters and color.
With this option, the text charts may be displayed in color, as well as with real graphics characters instead of with things like dashes and pluses. This makes the text charts look almost as neat as their color graphics counterparts. All that’s needed is a terminal that accepts Ansi escape sequences. You will get garbage if you include -k on a non-Ansi terminal. (For this reason, the default for this flag is off for non-Windows systems, although it can be made on all the time by setting the appropriate flag in the astrolog.as configuration file.) Most PC’s are in Ansi mode, so if you have a PC this should work. Include the -k switch on the command line, and the program will display all charts as before, but change the color appropriately for every part of any chart printed! Just try a -w chart, a -g grid, or a -t list and see the difference of how much easier it is to find a planet or aspect among a large chart! I highly recommend this setting be made on by default in the astrolog.as file if your system will support it, especially for PC users who display text charts on the screen more often than they print one out.
Color isn't used randomly but is based on logic. Most colors are very similar to the ones chosen in the color X charts. In general, everything is based on the following rules for elements: Fire is Red, Earth is Yellow, Air is Green, and Water is Blue. Zodiac signs and positions are printed in the color of their element. Houses are printed in the color of their corresponding sign. Planets are printed in the color of the sign they rule. As for the other objects, we have the following colors: Asteroids are in bright purple (magenta), Uranians are in dim purple, and non-physical points like the Node, Fortune, and Vertex are in a bluish gray (dark cyan). Stars are either orange if they are bright (magnitude < 1.0) or a dark red if dimmer. For aspects we have the following: Conjunctions are Yellow, Oppositions are Blue, Squares are Red, Trines are Green, Sextiles are Light Blue (Cyan). For the minor aspects we have magenta for inconjunct/semisextile, orange for semisquare/sesquiquadrature, dark cyan for all the quintiles, dark purple for all the septiles, and dark red for all the noviles.
-k0: Like -k but only use special characters, not Ansi color.
This minor switch is just like the -k switch, however it only toggles whether the high Ascii graphics characters are used, as opposed to -k which toggles both that and whether Ansi colors are used. A system with a black and white monitor may want to use high graphics but not color, while a system with a foreign character set may prefer color but not graphics characters.
-kh: Text charts saved to file use HTML instead of Ansi codes.
Astrolog supports saving text charts in HTML format. This is useful in order to transfer Astrolog text into other programs with color formatting intact. When this setting is on, in the Windows version the Save Chart Text Output command will produce HTML format files instead of plain text files, and the Copy Chart Text Output command will put “HTML Format” content on the Windows clipboard. Note that Web pages have a white background by default, which means that output will appear similar to Astrolog screen text when the reverse background setting (-Xr switch) is on. That means white text will be black in the HTML file, and light gray text will appear dark gray and vice versa.
-X: Create a graphics chart instead of displaying it as text.
This is the general switch, which means display a chart in an X window instead of on the screen in some form. For example, the command 'astrolog -i mychart -X' will open a new window and display the chart in question in it. (Of course, all the other switches, e.g. -R, -c, -1, etc, can be used to change what info is actually displayed.) If you use the -L astro-graph switch in addition to this, the appropriate Astro*Carto*Graphy map will come up in a window instead of the earlier boring list of longitudes. (e.g. astrolog -i me -X -L) The -Z and -g switches will produce their own chart types as well, although, of course, only one type of chart can be in a window at any given time.
-Xb: Create bitmap file instead of putting graphics on screen.
This switch will cause a bitmap file to be produced and written to a file instead of putting the graphics on the actual screen. This is useful if you want to convert the graphics to different formats, e.g. so they can be displayed on alternate systems, etc. Note that -Xb (or any other -X<letter> switch) automatically assumes the -X switch above, so 'astrolog -i file -Xb' is sufficient (and you don't also have to include the -X).
-Xb[n,c,v,a,b]: Set bitmap file output mode to X11 normal, compacted, very compact, Ascii (bmtoa), or Windows bmp.
The bitmap file can be written in five different formats; by default whatever format specified at compile time is used. One can change this mode by putting an extra character on the command line after the -Xb switch. Specifically, to override the compile time mode, use -Xbn for a standard X11 bitmap, -Xbc for an X11 bitmap with some white space removed, -Xbv for a very compact X11 bitmap (which may not be able to be processed correctly by all X programs), -Xba for a one character per pixel Ascii dump identical to the result generated from the X11 bmtoa program, and finally -Xbb for the Windows .bmp bitmap described below.
One of the available bitmap formats are the .bmp extension bitmap files commonly used on PC’s running under Microsoft Windows. If you have a PC running Windows, you can set your root background to be one of these monochrome Astrolog bitmaps by: use the -Xb option to create a bitmap file, then rename it to have the extension .bmp and put it in your Windows subdirectory, then go into Program Manager -> Control Panels -> Desktop and select this file to be your “wallpaper”. These bitmap files may be generated in either color or black and white. By default, all graphic charts will be in color, unless specified otherwise. Color is most useful for these PC bitmaps (-Xbb), although a color bitmap will take up more disk space. X11 bitmap files will always be output in monochrome format, since color .xbm files don't exist. A color Ascii file (-Xba) will have the color value of each pixel converted to a hexadecimal number, instead of being in the format generated by the Unix bmtoa utility in the case of monochrome charts.
-Xp: Create PostScript vector graphic instead
of bitmap file.
-Xp0: Like -Xp but create complete instead of encapsulated
file.
Astrolog can generate PostScript graphics files. PostScript is a graphics format different from bitmaps in that it’s based on vector “strokes” as opposed to “pixels”. With a vector graphic, an image is defined in terms of “circle here, line there, etc” instead of a large array. This means PostScript graphics can be printed at any size without losing accuracy or becoming “blocky”, and look perfectly smooth when printed to a laser printer. A PostScript file is also about an order of magnitude smaller in size than a corresponding bitmap file.
To generate a PostScript chart, use the -Xp switch. This will work just like bitmap files for all Astrolog’s graphics charts, in that you will be prompted for a file to write the graphics to unless you explicitly pass a file to the -Xo switch. The type of file generated will be an encapsulated PostScript graphic (which are usually seen with a .eps extension) meaning that it’s made to be inserted into a document and scaled and so on and printed from there. A true independent PostScript file which can be sent directly to a printer can be generated by specifying -Xp as -Xp0 instead. As with bitmaps, it is recommended to include -Xm for a monochrome graphic unless you have a color printer, and to include -Xr so the chart is black on a white background (so that you don't cover 90% of the page with ink when printing)!
There is a compile time option #define PS in the astrolog.h which can be commented out to disable the -Xp switch and all PostScript features. Note that on an X window system one may directly print out a bitmap to a PostScript printer even without this internal support. One simply brings up an Astrolog chart in an X window, or creates a bitmap and displays that bitmap in a window using some other graphics program, and then uses the Unix command “xdpr” to print it, with a line such as “xdpr -P<postscriptprintername> -device ps”, and then clicking on the window to print it to the specified printer. Of course, the native PostScript charts will look much smoother.
Special thanks to Mr. Brian D. Willoughby who wrote the routines and parts in the file xgeneral.c which deal with PostScript (e.g. what’s the PS command to draw a line, ellipse, filled rectangle, etc.) Basically, if it’s inside #ifdef PS, Brian likely gets credit for it, for anything else (except the placalc.c file of course, and the Matrix routines which are marked as so) I'm the one to blame. :)
-XM[0]: Create Windows metafile vector graphic instead of bitmap.
Yet another graphics format, Astrolog can generate Windows metafiles. Metafiles are those files (usually with extension .wmf and often called “pictures” for users) that are frequently used in Microsoft Windows for clipart and other such things. (Astrolog is one of the few non-Windows programs which can generate metafiles internally without relying on Windows itself.)
Like PostScript, metafiles are a vector graphic format. Metafiles are in binary format unlike the human readable Ascii text in PostScript files, and hence are smaller in size for the same image. Although the same chart generated in PostScript and metafile format will more or less look the same, for PC and Windows users, metafiles are preferred. (For Unix systems PostScript is preferred since there aren't many Unix apps out there that know or care about Windows metafiles, while PostScript is a standard used everywhere.) A metafile can be inserted as a picture into Word, CorelDraw, and pasted into Windows Write and many other applications. Unlike PostScript, a metafile can be displayed on the screen in your document, instead of like most EPS files which when displayed by Windows just indicate that “this is an PostScript image” and have to be printed to be seen. A metafile can actually be edited in MS Draw and many other drawing applications where one may modify the Astrolog chart, change colors, add text, and so on before printing!
Metafiles (and PostScript graphics) have the option to include actual system fonts for text, as well as even zodiac sign, planet, and aspect glyphs! This will look smoother than having Astrolog fake all the characters with 45 degree line segments. There is a setting in the astrolog.as file which when set by the user will always use system fonts instead of simulating them. If the -XM switch is invoked as -XM0 instead, the status of this flag will be toggled for the chart generated. (This switch can be used with PostScript charts by specifying “-XM0 -Xp”.) In the PostScript charts, the following printer fonts are used: Courier for text, Times Roman for house labels, and Astro for Sign, Planet, and Aspect glyphs.
For these metafiles, the following Windows TrueType fonts are used: Courier-New for text, Times New Roman for house labels, Wingdings for sign glyphs, and Astro-SemiBold for Planets and Aspect glyphs. All of these fonts should be installed in your system already except likely Astro-SemiBold. This font, created by Kenneth Hirst, is available at http://www.ffonts.net/Astro.font. To install it on Windows, unzip this file, then go into the Windows Control Panel and select the Fonts icon. Click on the Add button and select the file “astro-se.ttf” that was in the zip archive, and the font will be installed on your system. If it’s not installed, the planet and aspect glyphs will appear as letters. (Hack: If you can't get access to the Astro font, but still want all the other fonts to be included, one can set the value of the -YXf “use actual fonts” setting in astrolog.as to 2 instead of 1, which will cause only the planet and aspect glyphs to be simulated by Astrolog.)
It is possible that a metafile using all the system fonts may print perfectly to a PostScript printer, but a PS file itself won't find the Astro font. This is because the Astro font may be installed on your Windows system, but not on the printer itself, and because when printing a metafile to a printer, Windows will conveniently automatically embed the necessary font information in what it sends to the printer if the font isn't already there. Note that one may actually generate a PostScript chart from a metafile in Windows by using the Print Manager (or the Setup dialog button available from within those Windows host applications that use the standard Print dialog) to set printing to be to an encapsulated PS file instead of directly to a printer. Of course doing this won't likely be needed since Astrolog can generate PS files natively.
Like bitmaps, creating metafiles is also efficient in how it uses memory. Astrolog will attempt to allocate a large buffer for them, and keep decreasing the amount until it succeeds. (Note that the related PostScript charts don't need any memory buffers because they’re written to disk while being generated.) There is a compile time option #define META in the astrolog.h which can be commented out to disable the -XM switch and all metafile features.
-X3: Create Daedalus wireframe vector file instead of bitmap.
Astrolog supports saving graphics charts in 3D wireframe format. These wireframe files are a vector format similar to the PostScript and Windows metafile formats, except they’re true 3D models formed of line segments with separate X, Y, and Z coordinates. Such wireframe files can be viewed from different angles, rendered in perspective, and even explored from inside. With the right software and hardware, one could potentially use a 3D printer with an Astrolog wireframe, and have a physical 3D model of your chart! :-)
Most charts in wireframe mode are just lines drawn within a 2D plane, however some Astrolog charts have special wireframe versions of them that are fully 3D. The chart sphere and the globe charts are self-explanatory in wireframe mode since they’re already 3D models. The solar system orbit chart plots the planets in 3D space, in which the inclinations of the orbits above or below the ecliptic can be seen. In all wireframe charts, planet glyphs are in the horizontal plane (so they’re best seen looked down on from above) and the points where planets actually are located are marked with small wireframe diamonds.
More specifically, Astrolog produces wireframe files in the Daedalus wireframe format. That is a plain text file format listing the numeric coordinates of each line segment, which is simple enough to be edited by hand or converted to other 3D formats. The easiest way to view and work with Daedalus wireframe files is by loading them into Daedalus, a graphics program by the same author. See http://www.astrolog.org/labyrnth/daedalus.htm for more about the program Daedalus. Note that Daedalus versions 3.2 and before only support monochrome wireframes, so Astrolog needs to be in monochrome mode (-Xm switch off) in order for older versions of Daedalus to be able to properly parse the Astrolog generated wireframe file. For an example of Astrolog generated wireframe files rendered in Daedalus, see this video: https://www.youtube.com/watch?v=UdRaDGXBV-0
-Xo <file>: Write output bitmap or graphic to specified file.
This switch is used in conjunction with the -Xb, -Xp, or -XM options, to specify the name of the file to write the graphic image to. If not included the program will prompt you for the filename before writing to disk.
-XB: Display X chart on root instead of in a separate window.
For X window systems only, this switch will cause the chart graphics to be displayed directly on the root window. This action occurs very quickly since the program does not have to write a separate bitmap file and call xsetroot -bitmap on it (although one could easily do this if they want to). For example, one could put the line 'astrolog -n -XB' in their .xsession file and whenever they log in, their background will be set to a chart of the current state of the planets!
-Xm: Create monochrome graphic instead of one in color.
For systems without color monitors, the -Xm switch will create all charts in monochrome B/W mode. One can still generate color bitmap files on a monochrome system, just can't properly display them of course.
-Xr: Create chart graphic in reversed colors (white background).
Normally the charts comes up white on a black background. To get the chart or bitmap displayed in reverse video (black on white), use this -Xr switch.
-Xw <hor> [<ver>], -ge[..]: Change the size of chart graphic.
The default graphic chart size is 480x480 units. This can be changed with the -Xw switch. -Xw with one argument n will make an n by n chart; -Xw with two arguments x and y will make an x by y image. Note that this switch will not affect astro-graph or aspect grid windows; to change the size of these use -Xs below.
For X window systems only, Astrolog accepts the standard -geometry switch (which can be abbreviated as -geom or anything starting with -ge). This is only an alias to this -Xw chart size switch, in that it takes the same parameters in the same way. If -Xw is passed zero under X Windows, it will use the compile time default window size.
-Xs <100,200,300,400>: Change the size of map or characters by %.
Note that the size of the planet and sign glyphs don't change when you change the size of a graphics chart. This can cause problems for very small charts where the glyphs overlap the rest of the chart and for very large charts where there is lots of excess space. The -Xs switch can be used to change the size of all glyphs. The valid values that can be passed to it are 100, 200, 300, and 400 where 200 is the default. Note that this switch is used to change the size of the astro-graph (and aspect grid) graphic charts (because the world map is sort of considered to be one giant glyph by the program.)
Astrolog has its own internal character set definitions for the glyphs which it just draws at a higher scale based on the -Xs setting. This can make glyphs at higher scales look slightly blocky. To help prevent this, there’s a second alternate “internal font” of double sized glyphs for planets, signs, aspects, and house numbers, which allow the 100% or small scale, and the 200% or medium scale glyphs, to appear smooth to the nearest pixel. (The improved larger glyphs are also used at the 400% or huge scale, and when printing.)
-XS <100,200,300,400>: Change size of graphics chart text by %.
The size for text within graphics charts (such as the text in the wheel chart sidebar, and the text at the bottom of the screen in other charts) can be changed with this switch. The valid values that can be passed to it are 100, 200, 300, and 400 where 100 is the default. On high resolution monitors with many pixels, the default text size may be small enough to be hard to read, so increasing it may be appropriate.
-XQ: Ensure square charts remain so regardless of bitmap size.
This setting will force all graphics charts to be square, assuming they can be resized arbitrarily and look better when square. This option is similar to running the “Graphics / Square Screen” menu command in the Windows version after every manual window resize (except it won’t automatically resize the window to fit the final chart size, but rather will draw within the largest square area within the window). If this option is not on, then resizing a wheel chart will result in an elliptical wheel.
-Xi: Create chart graphic in slightly modified form.
The display of graphics charts can be modified in various minor ways, i.e. in either adding or removing certain information. Rather than add a new hard to remember minor option for each change, there is one comprehensive switch which covers all charts. The -Xi switch will invoke this “induce/inhibit information” option, and pressing the 'i' key in a window will accomplish the same thing by toggling the mode’s status. By default, all the charts are as before, but when this option is set, it affects each graphic chart in a different way, as follows:
For the standard -v and relationship -r0 -v wheel charts, it will inhibit the display of the aspect grid in the center, which can be useful when doing large time lapse animations when it would get in the way.
For the -g aspect grid, it will flip the aspects and midpoints across the center diagonal, i.e. the midpoints will be below it and the aspects above it, instead of the other way around. For the -r0 -g relationship aspect grid, the entire grid will be replaced with one showing all midpoints between all the objects in the two charts. Note: The -g0 switch when combined with -r0 will also generate a relationship midpoint (as opposed to aspect with just -g) grid. However, this will revert back to the aspect grid if both -Xi and -g0 are in effect with -r0.)
For the -Z horizon chart and -S space chart, it will, for the major planets, increase the size of the “points” showing where each object actually is, making a brighter “spot”, for easier viewing; combine this in the horizon chart with the 'l' key label inhibitor and get a very realistic view of the night sky, with planets brighter and all.
For the -L astro-graph chart, this will eliminate the display of the Ascendant, Descendant, and Nadir lines, leaving just the vertical Midheaven lines and zenith points, for a remarkable increase in speed and much less clutter when including many objects.
For the -XW world map display, -XG globe display, and -XP polar globe display, it will display the zenith locations of all planets (and stars if -U in effect) on the globe, i.e. where on the Earth each object could be viewed by looking straight up. This on the globe display is almost identical to the astro-graph chart without its various lines, except of course that the projection of the world map is different. It’s also similar to the -Z horizon display, except that it’s free from the distortion of projecting the celestial sphere upon a plane, so it has use to star gazers. However, animation mode here will still only affect what part of the Earth is viewable, and won't update the chart from which the zenith locations were obtained.
Note there is an interesting thing that can arise with the -XW, -XG, and -XP switches: These displays can be brought up in a window without having to specify an actual chart. Now suppose one presses 'V', 'L', etc. to bring up a chart - what will be displayed? The answer will be whatever initial values were already there, and if you’re curious, it’s set to be my own birth data: 11:01am PST (8 hours before UTC) on Friday, November 19, 1971 in Seattle, WA (122W19:59 47N36:35). This info can also be brought up by accessing the “-i nul” virtual chart straight from the command line before any other switches.
For the -E and -Ey graphical ephemeris displays, it will exclude showing the Moon and Part of Fortune without having to restrict them, which is commonly desired because their lines move across the ephemeris chart much faster than any of the other objects.
-Xt: Inhibit display of chart info at bottom of graphic.
Normally, at the bottom of any chart graphic is printed some header information listing the date, time, and location of the chart in question (unless the info is already being shown in a sidebar). One can inhibit this display by specifying the -Xt switch.
-Xu: Inhibit display of a border around graphic.
This switch toggles off the border setting, which is also interactively toggled by pressing the 'b' key when a graphics screen is up. This covers the rectangular border around the outside of most charts, as well as the circular border around globes and the elliptical border around the Mollewide projection of the world map. This switch allows one to toggle the border for graphics files, as well as set the default for this in the astrolog.as file.
-Xl: Inhibit labeling of object points in chart graphic.
This switch will inhibit labeling with glyphs or text abbreviations, the spots indicating the positions of planets in the various graphics charts. This is just the command line counterpart to the existing functionality accessed by the 'l' key.
-Xj: Don't clear screen between chart updates, drawing trails.
This switch will toggle on a flag which will cause the graphics screen to not be cleared on new chart draws. Pressing the 'j' key interactively will toggle the same setting. This feature is used to draw “jet trail” streaks on the screen for some charts, such as the -S orbit and -Z local horizon. If you bring up one of these charts, turn on the setting, and then animate forward, a “time exposure” can be done showing the orbits of planets or an object’s path across the sky.
-Xe: Draw Earth's equator in certain charts.
This switch causes Earth’s equator to be displayed in graphics charts. The equator can be displayed in the graphic local horizon chart, along with in the chart sphere, world map, and globe displays. Note that in local horizon charts and chart spheres, the equator line always passes through the East and West points (i.e. where the prime vertical intersects the horizon).
-XU: Draw all stars from sefstars.txt file in certain charts.
Astrolog supports displaying thousands of stars in its graphics charts. These extra stars will appear in the chart sphere, graphic local horizon chart, and constellation map charts. Unlike the actual 47 fixed star objects that Astrolog has supported for many versions, these extra stars aren’t labeled, and can’t be individually restricted. In the Windows version and when saved to wireframe files they will be colored different shades of dark or light gray according to their brightness in the night sky. In contexts with a limited color palette these extra stars will all be dark gray. These stars are the complete set of stars from the Swiss Ephemeris file sefstars.txt that comes with Astrolog. Altogether there are 1122 stars total by default, and when displayed they allow one to see constellations in the sky such as the Big Dipper.
-XC: Draw house boundaries or alternate info in certain charts.
This switch controls whether house boundaries are displayed in graphics charts, or it toggles the display of various details related to houses. This setting affects different graphics charts in different ways:
Local horizon and chart spheres: Whether house boundaries are drawn.
Note these can be either 3D or 2D house boundaries, depending on whether the 3D
houses setting is active (-c3 switch).
Solar system orbit: Whether sign boundaries are drawn.
Maps and globes: Whether sign boundaries and the ecliptic are drawn.
Wheel charts: Whether a dotted line is drawn from planets in outer wheels to
the innermost wheel. Even for the common single wheel chart this setting has a
minor effect, and determines whether the dots for each planet are larger.
-X1 <object>: Rotate wheel charts so object is at left edge.
Yet another graphics feature, this allows one to effectively rotate one of the graphic wheel charts so that a particular object is hinged to the left hand (east) edge of the chart. Given the -X1 switch with the index value of an object, the wheel is drawn but always rotated so that the object in question is at the left side of the chart. By default we have the ascendant at the left edge, of course. This is useful for tracking important planets so one knows where they are, but yet doesn't distort the house cusps as the -1 switch does.
-X2 <object>: Rotate wheel charts so object is at top edge.
This is identical to the -X1 switch above except here we rotate the entire graphic wheel so the object in question is always at the top of the chart. Note that during a day, the degree difference between the Ascendant and Midheaven varies in most house systems, so that with the Ascendant hinged at the left edge, the Midheaven will wobble back and forth near the top of the wheel. If you prefer, “-X2 Mid” will fix the Midheaven at the top of the screen, and the chart will be like before except the Ascendant will be the one to wobble near the left edge of the chart.
-Xd <name>, -di[..] <name>: Open X window on specified display.
For X windows only, the -Xd <display> switch can be used to change the display to bring the window up on. Normally, the X window will always come up on the current display, but we can do things like “astrolog -Xd machine:0.0” and have the window appear there. In addition, the program will accept this string through the standard “-display” (which can be abbreviated as “-disp” or anything starting with “-di”) switch common to most X11 applications.
-XX[0] [<degrees> [<degrees>]]: Display chart sphere instead of wheel.
Astrolog supports chart spheres, which are like standard chart wheels but in 3D. Chart spheres make it easy to see the ecliptic latitude of planets in addition to their zodiac longitude. They are most similar to the -Z switch graphic local horizon charts, except instead of being a flat rectangular map, the celestial sphere is rendered like a globe.
In a chart sphere, its equator marks the plane of the local horizon. Lines are drawn from the center in the four directions, which are labeled around the horizon. Between the zenith point straight up, and the nadir point straight down, can be seen the prime vertical running through the east and west points on the horizon, and the meridian running through the north and south points on the horizon. The 3D boundaries of the 12 houses can be seen, in which houses 1-6 are below the horizon and houses 7-12 are above, and in which houses 1-3 and 10-12 are east of the meridian and houses 4-9 are west of the meridian. Display of the houses can be toggled with the show house details setting (-XC switch, or the Graphics / Show Map Effects / Show House Details command, or with the “d” key). These houses will show either 3D house boundaries or classic 2D house boundaries, based on the 3D houses flag (-c3 switch, or the Setting / House Settings / 3D Houses command, or with the “a” key). In addition, the ecliptic and the 12 zodiac sign wedges are displayed. Display of signs can be toggled with the Vedic format flag (-J switch, or the Setting / House Settings / Vedic Wheel Display command, or with the “z” key). Finally, the astronomical constellations will be displayed upon the surface of the sphere if the Show Constellations setting is on (-XF switch, or with the Graphics / Show Map Effects / Show Constellations command, or with the “F” key).
Planets will be plotted on the surface of the sphere based on their zodiac position and latitude locations. Most planets will be on or near the ecliptic, except for Pluto, asteroids, and especially fixed stars. Aspect lines will be drawn through the middle of the sphere. If aspect lines make the display too cluttered, the orbs can be reduced or aspects turned off altogether. When Astrolog is showing two, three, or four charts at once, then the chart sphere will overlay all sets of planets upon the sphere, instead of just showing the first set of planets. This result will be a bi-sphere, which is like a bi-wheel but for a 3D chart sphere instead of just a 2D wheel chart.
The sphere overlaps its “near” and “far” sides, with the far side solid, and the near side semitransparent in which planets and such are rendered in gray. This simulates the viewer being inside the sphere, focusing upon what is in distance, such as a person looking south toward the ecliptic assuming a northern hemisphere chart location. If the -XX switch is invoked as -XX0 instead, the transparency will be reversed and the near side will be solid and the far side semitransparent, as if one were outside the sphere looking upon its surface. In the Windows version, the “Globe Halves Focus On Southern Hemisphere” flag in the Graphics Settings dialog controls this, and can be toggled with the Graphics / Modify Chart command. If you don’t want any overlap at all, turn on the modify display flag (with the -Xi switch, or the Graphics / Modify Display menu command) and only the solid half of the sphere will be drawn.
Similar to Astrolog’s -XG switch globe display, the chart sphere can be rotated and tilted. Two optional parameters to the -XX switch indicate how much the sphere should be rotated around its axis, and how much it should be tilted toward or away from the viewer. While a window is up, the sphere can be rotated left and right with the “{“ and “}” keys (or the Graphics / Globe Tilt / Rotate West and Rotate East menu commands), and can be tilted with the “[“ and “]” keys (the Graphics / Globe Tilt / Tilt North and Tilt South commands). Rotating and tilting is a good way to better visualize the sphere and its contents.
-XW: Simply display an image of the world map.
I painstakingly entered the data for the world map used by the program by hand using an atlas during a long week. If you just want to see the map of the world by itself without any astro-graph lines on it, use the -XW switch.
If the 3D houses setting is active (-c3 switch), then overlaying the world map will be shown the Earth’s ley line locations. Ley lines are spiritual lines of energy crossing the Earth. I was experimenting with the master ley line grids on the Earth (in the pattern of an overlapped 20 sided Icosahedron and 12 sided Dodecahedron) and I figured Astrolog with its world map would be an interesting program to explore them with. This belongs more to the field of dowsing than to astrology, but I figured I would make it available for amusement and inspiration.
-XW0: Like -XW but do a non-rectangular Mollewide projection.
The -XW0 switch is just like the normal -XW switch in that it just displays the world map and nothing else, except that this -XW0 map generated will be in what’s called the Mollewide projection, a good looking form often used for maps of the world, as opposed to the standard rectangular map projection used in -XW which distorts the polar regions of the globe across the top and bottom of the screen. (The Mollewide projection pinches the polar regions together, generating a elliptical map, which is similar to the -XG globe displays, but which shows the whole world instead of just half.)
-XG[0] [<degrees> [<degrees>]]: Display image of world as a globe.
Given the data for the map of the world, there are several nice things we can do with it. For instance, with a little trigonometry and clipping, we can bring up a view of a globe, which is what the -XG switch does. An optional argument will specify a rotation value in degrees to display different parts of the globe.
This graphic globe display can be displayed semitransparently, with the continents or constellations on the back side of the globe drawn in a dotted fashion. Select this option with the -XG0 subswitch, or by turning on “Globe Halves Focus On Southern Hemisphere” in Graphics Settings. In the Windows version, this can be toggled with the “Graphics / Modify Chart” command.
Note that the -XW and -XW0 maps can be animated like as this -XG globe display can. Animation of these maps are done by shifting the whole map to one side or the other. Because the -XW world map and -XP polar globe display can be animated just as the -XG general globe display can, the -XW and -XP switches accept optional parameters on the command line that will specify what degree (from 0 to 359) to start the map at, just like the -XG switch does. In addition, the -XG option itself accepts a second optional parameter, which is the starting angle for the globe’s tilt, from -90 to +90 degrees.
-XP[0] [<degrees>]: Like -XG but create globe from polar projection.
The -XP option will generate a polar view map of the Earth. This is similar to the -XG globe option except that the view is always with the north pole in the middle, and the opposite pole around the outer edge. By default, the view is looking down on the north pole with 0 deg W/E toward the bottom of the screen. (Animation mode will cause the view to spin about the center of the screen.) To see a view centered on the south pole, invoke this switch as -XP0 instead. Again, like with all the other windowed display modes, one can enter this display with a keystroke: press 'P' in any Astrolog window and it will change to this display.
-XF: Display maps as constellations on the celestial sphere.
A graphics chart showing all 88 of the astronomical constellations is available with the -XF switch. When this mode is active, the -XW world map and -XG and -XP globe chart modes will draw the outlines of the constellations on the celestial sphere instead of continents on the Earth. Pressing the 'F' key when a graphics screen is up will toggle this setting on. (If you aren't already in one of the map graphics modes, -XF and the 'F' key will switch to one.) The constellation maps may be rotated, tilted, and animated and can do everything else just like the world maps, and depict the sky as if you were looking up at it from Earth. In the -Xi display modification mode, the locations of the planets in the current chart will be shown among the constellations. The constellations are labeled with their correct abbreviations, and you can see the familiar image outlines such as the Great Bear, Cygnus, and all the others, as well as the constellations named after the twelve signs of the zodiac, and how these astrological signs compare with their corresponding constellations. I happen to have four planets in my own natal chart in the constellation Ophiuchus, while there are several other constellations very close to the ecliptic which planets (other than the Sun) often enter, e.g. the Moon will technically be in Orion on September 27th. As with Astrolog’s map of the world, I entered the data describing the irregular shape of each constellation myself, and the boundaries are accurate although rounded to the nearest degree. This is a unique feature that isn't in many astronomical programs much less astrological! For a demo of this, do “astrolog -i yourchartfile -XF -XG -Xi -Xn -U” and see a rotating celestial sphere of the constellations and stars, and where the planets in your natal chart are located within them.
-Xn [<mode>]: Start up chart or globe display in animation mode.
The -Xn [<value>] option can be used to start up an X window in animation mode. It a window, one would have to explicitly press 'N' or a shift+number key to start the window animation. Without a parameter after -Xn, the option will start it up in continuous update to “now” mode (which is like pressing 'N' in that any chart will be erased with the current chart now.) The switch can accept parameters from 1..9, corresponding to the animation rates obtained by pressing shift 1..9 in the window, i.e. update whatever chart is passed to it seconds, minutes, hours, days, months, years, etc. later each time.
-XN: Map animates chart time instead of rotating map itself.
This flag controls whether animating a map display (such as a globe, map, or chart sphere) will animate the orientation of the map itself or the time of the chart within the map. By default map displays animate the map orientation, however this option allows one to animate the chart within the map.
-XM[2-4][0] <strings>: Define macro(s) to run when chart drawn.
The -XM2, -XM3, and -XM4 switches allow different graphics to be used for different rings in a bi-wheel, tri-wheel, or quad-wheel chart. The switches take 2, 3, or 4 string parameters respectively, and each string is a command line that gets automatically applied before drawing that ring. For example, you can do things such as have rings with different glyphs, different character scales, or different restrictions.
-HX: Display list of key press options for screen graphics.
This switch prints out the list of keys one can press when a graphics screen is being displayed. This list may also be obtained by pressing the '?' key interactively when graphics are actually up. With -HX, this may be done anytime and be printed out or sent to a file like all other Astrolog tables.
-W <value>: Run given Windows menu command internally.
For the Windows version only, this obscure switch allows one to invoke a menu command from a command line, taking one numeric parameter indicating the item to run. Values 40001 through 40263 are valid menu commands, where the list of what number corresponds to what command is in the resource.h source file. An example use of this is to put “-W 40041” in your astrolog.as file which will start the program with the “Chart Resizes Window” setting on by default. Another example is having “-W 40237” on the command line of the program’s icon to have the Chart Info dialog come up on startup.
-WN <1-32000>: Set animation update delay in milliseconds.
For the Windows version only, this switch specifies the animation delay, taking one parameter indicating the number of milliseconds between the start of screen updates. This is the same as the “animation delay” edit control in the Graphics Settings dialog, and exists here as a switch so one may set a default value for it in the astrolog.as file.
-WM <1-48> <text>: Set Windows menu text for macro command.
For the Windows version only, this switch allows one to customize the menu text for the macro running commands, taking two parameters, the macro from 1-48 whose menu item to change, and the new text to put on the menu. An ampersand “&” may be used to put an underscore under the character following it, which will be used as the standard Windows menu shortcut for the command. For example, doing -WM 12 "Best friend's chart”, will edit the last item on the “Edit Run Macro (Normal Set)” submenu to read “Best friend's chart”. After it will still appear “F12” as this doesn't change the direct keyboard shortcut. (One should of course also use the -M0 switch to assign a macro to slot 12 here to actually display your friend’s chart when the macro is run.)
-Wn: Don't redraw screen until user forces update.
For the Windows version only, this switch toggles it so that the window will not redraw its contents until you force an update (with the Redraw Screen command or by pressing space). Normally the screen updates after every command or whenever a section of the window gets uncovered. However this constant redrawing may cause unwanted waiting on a slower system, especially if one is tweaking various minor settings in say a large transit search, and doesn't want to wait after each modification.
-Wo: Continually autosave graphics screen to bitmap file.
In the Windows version, this switch causes the program to automatically save a bitmap of the current graphics screen to a bitmap file “astrolog.bmp”, whenever the screen is updated. This specialized feature allows external programs to get the current state of Astrolog’s screen, which can be used for scenarios such as creating the following video: https://www.youtube.com/watch?v=euxwoyekZow
-Wo0: Continually autosave graphics screen to numbered files.
In the Windows version, this switch causes the program to automatically save a bitmap of the current graphics screen to a continually increasing sequence of bitmap files whenever the screen is updated, to “ast00000.bmp”, “ast00001.bmp”, and so on. Each time the -Wo0 switch is invoked, the counter will be reset to zero. This specialized feature allows external programs to see a list of Astrolog screenshots, which can be used for scenarios such as creating animated GIF’s: http://www.astrolog.org/astrolog/screen/globe.gif
-Wo3: Autosave graphics screen to wireframe instead of bitmap.
The Windows version can automatically generate and save Daedalus wireframe files as new graphics charts are displayed. This switch is just like -Wo, except that a wireframe file instead of a bitmap will be automatically generated and saved to file. The program Daedalus can be configured to automatically open and display such files. If Astrolog is animating the chart, then the wireframe rendered in Daedalus will be animating in the same manner, which allows creating videos such as: https://www.youtube.com/watch?v=UdRaDGXBV-0
-WSg: Setup Windows program group, for current user only.
In the Windows version, this switch creates a Windows program group for the current user containing pointers to the Astrolog executable, the main and update documentation files, and the Astrolog website.
-WSG: Setup Windows program group, for all users.
In the Windows version, this switch creates the same program group, but for all users.
-WSd: Setup Windows desktop icon for program.
In the Windows version, this switch creates a Windows desktop icon to launch Astrolog.
-WSx: Setup registering Windows file extensions for program.
In the Windows version, this switch associates Astrolog with “.as” extension files in the Windows registry. Note that the special switch “-setup” will setup a Windows program group for the current user, a desktop icon, and file extensions for program (which is basically a shortcut for the combination of “-WSg -WSd -WSx”).
-WSu: Unregister Windows file extensions for program.
In the Windows version, this switch undoes the effect of the previous switch, and unassociates Astrolog from “.as” extension files, which is useful for uninstall. Note these last two switches edit the current user’s settings within the Windows registry.
Astrolog (version 6.40) obscure command switches:
-Y: Display help list of less commonly used command switches.
This switch was described in an earlier section.
-YT: Compute true positions in space instead of apparent in sky.
This switch turns on true planetary positions, which means where planets actually are in space. Normally Astrolog shows apparent positions, which is where planets appear in the sky, or the true positions adjusted by the travel time of the speed of light. Most astrologers and astrology software work with apparent positions (although there’s no definitive proof that astrological influences travel at the speed of light). True positions will be up to half an arc-minute ahead of apparent positions, e.g. light from the Sun takes about 8 minutes to reach Earth, so the Sun has moved forward another 8 clock minutes through the zodiac. For the -S orbit chart, in which one is looking down at the solar system as a whole, it’s recommended to have true positions on (and topocentric positions off).
-YV: Compute topocentric positions instead of from center of body.
This switch turns on topocentric positions, which means positions relative to one’s location on the surface of the Earth. Normally Astrolog shows positions relative to the center of the Earth. Most astrologers and astrology software treat the Earth as a single point (although there’s no definitive proof that astrological influences affect everybody on all parts of the Earth equally). Because topocentric is relative to location on Earth, one’s elevation above sea level influences positions, and needs to be set separately (with the -zv switch). Positions with this setting may be different by more than half a degree, with the maximum change being the Moon (because it’s closest to the Earth) and when planets are near the horizon, because in those cases parallax has the biggest opportunity to alter positioning. Topocentric positions require Swiss Ephemeris to be active (which it is by default) in order to work, and also for the chart to be geocentric. For the -Z local horizon chart, in which one is looking at points of light in the sky from their local position on Earth, it’s recommended to have topocentric positions on (and true positions off).
-Yh: Compute location of solar system barycenter instead of Sun.
Astrolog supports barycentric charts with this switch, which has positions relative to the solar system barycenter, or the solar system’s center of mass. Barycentric is similar to heliocentric charts centered around the Sun, however the solar system barycenter will vary from the Sun’s position based on the positions of the planets (especially Jupiter which is the most massive). The solar system barycenter ranges from inside the Sun’s body to about one Sun radius from it. For geocentric charts, this setting will make the Sun’s position be the barycenter instead of the Sun itself, which can affect its position in geocentric charts by up to half a degree. In heliocentric charts, all positions will be relative to the barycenter instead of to the Sun.
-Yn: Compute location of true instead of mean node.
This switch sets whether the North Node and South Node in Astrolog (objects number 16 and 17) are the mean or the true nodes of the Moon. This also affects whether Lilith (object number 18) is the mean or true Dark Moon. The mean node is the default, but toggling on the -Yn flag will do the true node.
-Yd: Display dates in D/M/Y instead of M/D/Y format.
This is a switch which determines whether dates are displayed in Month/Day/Year order or in the more “European” Day/Month/Year format. Toggling on or off this flag will specify the DMY or MDY format everywhere in the program from text wheel charts to transit charts to the chart info displayed in graphics charts.
-Yt: Display times in 24 hour instead of am/pm format.
This is another option which is just like the above except that it affects how times are displayed throughout the program. When clear, times will be printed in am/pm format, while when set they will be in the more “European” 24 hour clock.
-Yv: Display distance in metric instead of imperial units.
When the program displays distances, it’s normally in imperial units (feet or miles). This switch will instead display distances in metric units (meters or kilometers).
-Yr: Round positions to nearest unit instead of crop fraction.
This switch displays zodiac positions rounded up or down to the nearest minute (or second when -b0 is active). Normally Astrolog displays positions by dropping any fractional part, so for example a position of 12Lib34 means the actual position is somewhere between 12Lib34:00 and 12Lib34:59. Not rounding is better when animating Astrolog, so for example the moment when 29Sag59:59 turns to 0Cap00:00 is the exact instant of the Solstice.
-YC: Automatically ignore insignificant house cusp aspects.
This option toggles on a useful flag to automatically prevent display of irrelevant or redundant aspects involving house cusps, processing them in a more intuitive manner. This affects charts such as -t transit search lists, -T transit influence charts, and -a aspect lists. First, aspects other than conjunctions to minor cusps will be ignored, e.g. a sextile to the 12th house cusp is redundant and isn't really useful, as we are more interested in the conjunction to the 2nd house. Minor aspects to the angles such as the Ascendant and Midheaven are left alone. The setting also prevents redundant aspects to two items that are always opposite each other, e.g. if a transit list shows a trine to the Midheaven, it won't show a sextile to the Descendant right next to it. However, if one object has been restricted, then any aspect will be allowed to an object always opposite it (e.g. if Ascendant restricted allow any aspect to the Descendant). Also if one aspect has been restricted, anything involving the supplemental aspect will be allowed (e.g. if Trine restricted allow all Sextiles).
-YO: Automatically adjust settings when exporting and printing.
This flag tells Astrolog to do the “smart” thing when exporting charts to other formats. This setting has two effects: (1) When printing, if the chart background is black (which it is by default) then the program will automatically reverse it to white when printing. That avoids the problem of printing and getting a mostly black piece of paper, which wastes ink. (2) When saving text charts or copying them to the clipboard, Ansi color will be temporarily turned off. That avoids getting Ansi escape sequence characters in the text, which in most cases isn’t wanted because the escape sequences aren’t parsed in most contexts.
-Y8: Clip text charts at the rightmost (e.g. 80th) column.
This setting when active will stop printing lines of text within charts if they’re long enough to go beyond the right edge of the screen. This can be used to prevent text from wrapping around the screen to the next line. By default, with all objects unrestricted, certain charts will have rows more than 80 columns wide, which can break up the chart making it difficult to read, e.g. the -r0 -g relationship aspect grid, the -E ephemeris listing, and the -L astro-graph columns when Uranians are included. With this option on however, these and any other charts that can go beyond column 80, will always be displayed on one line, with columns that would go beyond the 80th not getting printed. Note that this setting can actually clip at any column instead of just the 80th, where the screen width value used is the same as used for interpretation formatting, i.e. the optional parameter to the -I switch.
-YQ <rows>: Pause text scrolling after a page full has printed.
This feature gives you the option to have Astrolog automatically stop whenever the screen gets filled with text and prompt before scrolling to the next page. It takes one parameter to define the number of rows to print before prompting the user to press return to continue. If set to zero, the feature will be turned off and Astrolog will print continuously until done. This helps those who may be concerned about the program scrolling things off the screen before they can read it. Without this one would have to press Ctrl-s to have the system pause printing, send output to a file to inspect afterward, or be on a system with scrollbars to see everything. This feature is off by default, but can easily be changed to a common screen height such as 24 rows in the astrolog.as file. When the program is paused, one can type a couple things before pressing return: Entering ‘q’ or ‘.’ will terminate the program, entering ‘Q’ will turn off the feature and scroll until done, ‘8’ will toggle the right hand column clipping setting, and ‘k’ will toggle the Ansi color setting.
-Yq[0-9] <strings>: Define command lines to run and show in sequence.
This obscure switch allows appending multiple text charts within a single display. It takes between 0-9 parameters, depending on whether it’s invoked as -Yq0, -Yq1, and so on. If there’s no digit character after -Yq, then it’s assumed to have zero parameters, and will turn off this feature. Astrolog will treat each parameter as a command line, and then display the resulting chart after each command line is processed. This is basically equivalent to having a batch script invoke Astrolog several times in a row and appending the results together. For example, “-Yq2 ‘-n _e =dm -R0 Sun Moo -A 0 -RA Opp -YR0 1 1’ ‘-i set _e _d _YR Mer Eas 0 0 0 0 0 0 0 0 0 0 0 0 0 0 1 0 0 0 0’” will cast a chart for the time of the Full Moon this month.
-Yo: Output chart info and position files in old style format.
Astrolog can still read in all old style -o info and -o0 position chart files generated by previous versions of the program without problem. Not only that, but it will write out these old formats too if the -Yo switch is put into effect. When set, it will output -o and -o0 files exactly as in version 4.10 and before, in simple lists of numbers in fixed fields instead of in generic command files.
-Yc: Angular cusp objects are house positions instead of angles.
This obscure switch determines whether the angular house cusp objects (i.e. indexes 21, 24, 27, and 30) contain the position of their respective house cusps, or the positions of the Ascendant, Nadir, Descendant, and Midheaven. These positions are always the same except for certain house systems, e.g. in the Equal house system the position of the 10th cusp is different from the Midheaven. Normally the angular house objects always contain the positions of the Asc, MC, etc, however this feature gives the user the option to have the objects' contents be the positions of the cusps as defined by the house system in use.
-Yp: Fix polar houses by preserving Ascendant instead of MC.
When a chart is cast in a polar region within the Arctic or Antarctic Circle, the Ascendant may be more than 180 degrees after the MC, which makes it impossible to have proper house cusps (at least for systems that associate the Asc with the 1st house and the MC with the 10th). Normally Astrolog addresses this by flipping the Ascendant 180 degrees if it’s in the wrong half of the zodiac. If the -Yp switch is set, the MC will be flipped 180 degrees instead. This setting has no effect when Swiss Ephemeris is active and computing house cusps.
-Yz <min>: Forward clock by amount for current moment charts.
This obscure switch, taking one parameter for the number of minutes, allows one to offset forward or backward the time considered to be the current moment now. This is useful if your -n now charts always seem to be a few hours or whatever off, as seems to be the case on certain Mac or Amiga systems. For example, if -n says it’s 3:30pm when it’s really 1:30pm, doing “-Yz -120” will back up the clock appropriately (and change the planetary positions slightly too). It’s important that this switch be used as a last resort instead of first, where one should first check their system time, the system time zone setting such as may be set with the TZ environment variable, and Astrolog’s default time zone. A line for this setting appears in the default astrolog.as file.
-Y1[0] <obj1> <obj2>: Rotate planets so one is at other's position.
This switch is similar to the existing -1 solar chart switch, except instead of rotating house cusps by an offset so they’re at a planet’s position, this rotates all planets by an offset so they’re at the original position of some planet. This switch takes two parameters specifying planets that represent an offset, such that after shifting, the first planet is at the original position of the second. If the switch is invoked as -Y10, it will instead rotate everything so the first planet is at the start of the sign of the second planet’s original position. This option is considered turned off and will have no effect if the two parameters are the same (and the “0” part isn’t active). This general feature allows generating certain types of charts, such as esoteric astrology wheels.
-Yl <1-36>: Toggle plus zone status of sector for sector chart.
This command switch is used with the -l sector charts and sets whether a sector is a plus zone sector or not. Taking one parameter of a sector number, it toggles the plus zone status of it. Like the -R restriction switches, the “_” prefix may be used to make a sector minus and the “=“ prefix to make a sector plus.
-YP <-1,0,1>: Set how Arabic parts are computed for night charts.
This is an obscure option allowing one to force whether night chart formula inverting is done in the -P Arabic part chart list, since sources differ on which parts are best inverted. This option takes one parameter, either -1, 0, or 1. Zero is the default setting, meaning the program will invert only those parts that have the flip flag set, for charts cast at night. If the setting is 1, then no inverting will ever be done for any part, even in night charts. If the setting is -1, then inverting will always be done for every part, even in day charts. Note that the POF does appear both in the -P full part list, as well as being the only part that’s also a standard object (object #18) meaning it’s the only part one may automatically do aspects or transits to. Note also that the -P list POF inverts for night charts, meaning the standard object in the main list does too.
-Yb <days>: Set number of days to span for biorhythm chart.
This switch, taking one parameter, specifies how many days to include in the biorhythm charts. It will control the number of days spanned in the text biorhythm listing, and number of days plotted before and after the given day in the graphic biorhythm chart.
-Ye <obj> <index>: Change orbit of Uranian to seorbel.txt object.
Astrolog supports custom planets beyond the set of objects it normally works with. This switch customizes planet positions. It takes two parameters: One for the object to replace, and another for the object to replace it with. The source object must be one of the objects in the Uranian hypothetical object category (Vulcan or one of the eight Uranians). The destination object is defined by an index in the “seorbel.txt” text file in the Astrolog install directory. For example, “-Ye Cup 9” will replace Cupido with Isis-Transpluto, and “-Ye Had 18” will replace Hades with Porserpina. The name and glyphs in the program won’t change, but the positions will reflect the new object. Note this feature requires Swiss Ephemeris to be active (which it is by default) in order to take effect.
-Yeb <obj> <index>: Change orbit of Uranian to external ephemeris.
Astrolog can access custom bodies whose positions are in external Swiss Ephemeris format ephemeris files (such as Eris and Sedna) with the -Yeb switch. This is similar to the -Ye switch which allows accessing the orbital elements of fictitious bodies in the seorbel.txt file. Simply download the desired ephemeris file from ftp://ftp.astro.com/pub/swisseph/ephe/ and place it in the same directory as the other ephemeris files. Pass the number of the ephemeris file to the -Yeb switch, and the Uranian object in question will be replaced with the positions of the new object. For example, to show the position of Eris, download ftp://ftp.astro.com/pub/swisseph/ephe/ast136/s136199.se1 and then do “-Yeb Cup 136199” to replace the position of Cupido with Eris. See http://www.astro.com/swisseph/astlist.htm for an index of which asteroids map to which numbers. You may also want to change the object’s name and graphic glyph to complete the customization.
-YeO <obj1> <obj2>: Change orbit of
Uranian to internal planet.
-Ye[..]n <obj> <index>: Change Uranian to
North Node of object.
-Ye[..]s <obj> <index>: Change Uranian to
South Node of object.
-Ye[..]a <obj> <index>: Change Uranian to
apihelion of object.
-Ye[..]p <obj> <index>: Change Uranian to
perihelion of object.
Astrolog can access the nodes and helion points of planets, by defining them as custom bodies. The -Ye command switch can be invoked in four different ways to select these points: -Yen for the north or ascending node, -Yes for the south or descending node, -Yep for the perihelion point or point on its orbit nearest the Sun, and -Yea for the aphelion point or point farthest from the Sun. (For the Moon, -Yep and -Yea produce the perigee and apogee points nearest to and farthest from the Earth.) These four points exist in space, and the planet in question will pass through them along its orbit. As with the Moon’s nodes, Astrolog’s true node vs. mean node setting (-Yn switch) will influence these positions. The -Ye switch is invoked in one of three ways to indicate the type of object in question: -Ye by itself for fictitious bodies in seorbel.txt, -Yeb for asteroids in custom ephemeris files, and -YeO for an existing planet in Astrolog’s standard list. For example, “-Yen Cup 9” redefines Cupido’s slot to be the north node of Transpluto or seorbel.txt object #9, “-Yebs Cup 9” redefines Cupido to be the south node of the asteroid Metis assuming se00009s.se1 has been downloaded, and “-YeOa Cup 9” redefines Cupido to be the aphelion point of Neptune or Astrolog object #9.
-Ye[..]HSBNTV <obj> <index>: Toggle heliocentric, sidereal zodiac, barycentric, true node, true position, or topocentric for object.
The -Ye switch allows the custom objects to have different settings from the default. For example, this feature can allow displaying the true node alongside the mean node and check for aspects between them, or plot how the Sun’s position changes over time relative to the solar system barycenter. The -Ye switch can be ended with six different subswitch characters:
-YeH: Toggle the heliocentric setting of the customized object (-h
switch).
-YeS: Toggle the sidereal zodiac setting of the customized object (-s switch).
-YeB: Toggle the barycentric setting of the customized object (-Yh switch).
-YeN: Toggle the true node setting of the customized object (-Yn switch).
-YeT: Toggle the true positions setting of the customized object (-YT switch).
-YeV: Toggle the topocentric positions setting of the customized object (-YV
switch).
-YE <obj> <semi-major axis> <eccentricity (3)> <inclination (3)> <perihelion (3)> <ascending node (3)> <time offset (3)>: Change orbit of object to be the given elements.
This feature allows one to “define their own planets”, by changing the orbital elements of one of Astrolog’s objects. This switch takes 17 parameters, which specify all the data needed for any elliptical orbit around the Sun. The parameters are as follows: First is the object to redefine; second is the semi-major axis of the new orbit, in AU; next are three parameters for the eccentricity of the orbit’s ellipse; next are three parameters for the inclination of the orbit with respect to the ecliptic, in degrees; next are three parameters for the argument of perihelion, which is the “rotation” of the orbit in degrees or how far away its perihelion is from zero Aries; next are three parameters defining the ascending node, which is the “tilt” of the orbit or how far away the point where the orbit intersects the ecliptic is from zero Aries; finally are three parameters for the “mean anomaly” which is basically where on the orbit the planet is at a reference time and how fast it moves along it. Many of the above element settings take three values when it seems like only one is needed. The second and third values are used as linear and quadratic error factors to the first, and can be zero unless every last bit of accuracy that can be provided outside of ephemeris files is needed. Note that these parameters basically replace the same elements as used in the old Matrix formulas. This means the -YE switch settings are ignored when the -b ephemeris flag is in effect. Note also that the Matrix formulas have special error factors applied on top of their main elements for Jupiter through Pluto, hence it’s recommended to only redefine asteroids, Uranians, or inner planets. The following example will roughly move Venus into Earth’s orbit: “-YE 4 1 0 0 0 0 0 0 0 0 0 0 0 0 0 0 23000”. Note this feature requires the old Matrix formulas (-bm switch) to be on in order to take effect.
-YU <obj> <name>: Change position of star to sefstars.txt entry.
Astrolog’s list of stars can be customized. The -YU command switch takes two parameters: The existing object index or star name to replace, and a string for a star name from the file sefstars.txt in the Astrolog install directory to compute instead. This star name can be the traditional or common name in the first column of the file, or the scientific nomenclature name in the second column of the file if the name starts with a comma. For example, “-YU Acheron Deneb” or “-YU 43 ,alCyg” will both replace the star Acheron (object #43) with the star Deneb or Alpha Cygni. You may also want to change the object’s name to complete the customization. If a star is renamed to “” or the empty string, then that will turn off customization for that slot, and return to Astrolog’s internal default. This feature requires Swiss Ephemeris to be the active method of star computation in order to work.
-YR <obj1> <obj2> <flag1>..<flag2>: Set restrictions for object range.
This is like the -R switch except that it explicitly sets the restrictions for a range of Astrolog objects instead of just one. The first two parameters specify the lower and upper object bounds, and are followed by zero or one flag parameters to clear or set the restriction status of each object within the range.
-YRT <obj1> <obj2> <flag1>..<flag2>: Transit restrictions for range.
This behaves exactly like the -YR switch above except it affects transit restrictions, like how the -RT switch is to -R.
-YR0 <flag1> <flag2>: Set restrictions for sign, direction changes.
This sets the restriction status for sign and direction changes. It takes two parameter flags, with the first setting for sign changes, and the second direction changes. This affects the -d daily event searches, and works like the -R restrictions but for all types of these special events, instead of all aspects or all events containing a particular object.
-YRZ <rise> <zenith> <set> <nadir>: Set restrictions for -Zd chart.
This switch allows one to determine which events appear in the -Zd rising and setting time chart. It takes four parameters, which respectively control whether rising events, zenith transit events, setting events, and nadir transit events are included in the chart. A zero value indicates to include that event, while a one means to restrict it. For example, to include only rising and setting events in the -Zd chart, do “-YRZ 0 1 0 1”. These restrictions also affect the -L graphic astro-graph chart, and will control whether the Ascendant, Midheaven, Descendant, and Nadir lines are drawn.
-YR7 <ruler> <exalt> <eso> <hier> <ray>: Set rulership restrictions.
This switch controls what types of rulerships and exaltations are shown in charts. It takes five parameters, one for each of the five types of rulerships: Standard rulerships, esoteric rulerships, Hierarchical rulerships, exaltations, and Ray Rulerships. As with other restriction switches, a zero value means show, and non-zero means restrict. The astrolog.as default settings file contains a line for these variables. Rulership restrictions will affect what’s shown in the standard -v chart list, what’s shown in the -7 esoteric chart, and also what set of rulerships is used in the graphic -J switch dispositor chart.
-YRd <div>: Set divisions within signs to search for degree changes.
The transit to transit times search (-d switch) can include planetary crossovers into a new degree. This is similar to the existing feature of the chart which shows planetary crossovers into a new sign. This switch determines how many sections to divide each sign into, when checking for a planet crossing into a new section. Only if this setting is greater than one will it introduce new events in to the transit times list. For example, setting it to 2 will divide each sign into two halves and display when planets transit the 15 degree mark of each sign, setting to 3 will divide each sign into three pieces and display when planets cross the 10 and 20 degree marks, 30 will display when planets cross each degree, and so on.
-YAo <asp1> <asp2> <orb1>..<orb2>: Set aspect orbs for range.
This is like -Ao but sets the orbs for a range of Astrolog aspects instead of just one. The first two parameters specify the lower and upper aspect index bounds, and are followed by a list of orb values for each aspect in the range.
-YAm <obj1> <obj2> <orb1>..<orb2>: Set max planet orbs for range.
This is like -Am but sets the maximum aspect orbs allowed to a range of objects instead of just one. Again, the first two parameters are the lower and upper object indexes, followed by the list of max orb values.
-YAd <obj1> <obj2> <orb1>..<orb2>: Set planet orb additions for range.
This is like -Ad but sets the planet orb addition values for a range of objects instead of just one. Again, the first two parameters are the bound indexes, and are followed by the list of planet orb additions.
-YAa <asp1> <asp2> <ang1>..<ang2>: Set planet aspect angles for range.
This is like -Aa but sets the angles to use for a range of aspects instead of just one. Again, the first two parameters are the bound indexes, and are followed by a list of angle degree values for each aspect in the range.
-YAD <asp> <name> <abbrev> <glyph>: Customize display names of aspect.
This changes the name of aspects, or what strings are used to display them in charts. The feature is best used if one customizes an aspect’s angle to a new value, to completely replace one aspect with another. This switch takes four parameters: The aspect to rename, and then three strings for the aspect’s new name, the aspect’s new three letter abbreviation, and a description of the aspect’s glyph. Note that renaming aspects only changes how they’re displayed in charts, which means command switches still need to refer to the aspect by its default name.
-Yj <obj1> <obj2> <inf1>..<inf2>: Set influences for object range.
This sets the powers or influences of the given range of planets, when considered in a natal chart, as used in charts such as the -j influence chart, -a aspect influence list, and -T transit influence list. Every object has its own index, except fixed stars are collectively covered by slot #43 (the index of the first fixed star). Setting that slot will set the influence for all stars. Similarly, the command line will parse the string "star" to match this index of the first star. For example, “-Yj star star 4” will set the influence of all stars to 4.
-YjC <cusp1> <cusp2> <inf1>..<inf2>: Set influences for house cusps.
This sets the influences for the given range of houses, as used in charts such as -j.
-YjA <asp1> <asp2> <inf1>..<inf2>: Set influences for aspect range.
This sets the influences for the given range of aspects, as used in charts such as the -j influence chart, -a aspect influence list, and -T and -D transit lists.
-YjT <obj1> <obj2> <inf1>..<inf2>: Set transit influences for range.
This sets the influences of the given range of planets, just like -Yj, except here for when the planets are transiting, as used in charts such as the -T transit and -D external planets influence lists.
-Yj0 <inf1> <inf2> <inf3> <inf4>: Set influences given to planets in ruling sign, exalted sign, ruling house, exalted house.
This switch takes four parameters and sets respectively, the extra influences given to a planet when it’s in the sign it rules, when it’s in the sign it exalts in, when it’s in the house corresponding to the sign it rules, and when it’s in the house corresponding to the sign it exalts in. These values are used in examples such as the -j influence chart.
-Yj7 <inf1> <inf2> <inf3> <inf4> <inf5> <inf6>: Set influences for in esoteric, hierarchical, Ray ruling sign, plus same for house.
This switch defines power numbers for esoteric positionings, as used by the -7 switch esoteric charts. It takes six parameters. The first three are the power added to a planet when it’s in the sign it esoterically rules, the power when a planet’s in the sign it Hierarchically rules, and the power when a planet’s in the sign it Ray rules. The second three are the same, but are the power added to a planet when it’s in the house corresponding to the sign it esoterically, Hierarchically, or Ray rules.
-YJ <obj> <sign> <cosign>: Set sign planet rules and co-rules.
This switch allows one to customize the rulerships of a given planet. It takes three parameters, the object to modify, the zodiac sign for it to rule, and a second sign for it to co-rule. Pass in the value zero to make a planet not rule any sign. For example, Jupiter by default rules Sagittarius and co-rules Pisces. If you'd prefer it to rule Cancer and not have a co-rulership, do “-YJ Jup Can 0”.
-YJ0 <obj> <sign>: Set zodiac sign given planet exalts in.
Similar to the -YJ switch, this allows one to customize the zodiac sign a given planet exalts in. It takes two parameters, the object to modify, and the new sign to exalt in (with a zero value meaning no exaltation). For example, to make Pluto exalt in Aries (and hence implicitly be debilitated in the opposite sign Libra) do “-YJ0 Plu Ari”.
-YJ7 <obj> <sign> <cosign>:
Set signs planet esoterically rules.
-YJ70 <obj> <sign> <cosign>: Set signs
planet hierarchically rules.
These switches customize esoteric and Hierarchical rulerships. They are very similar to the -YJ switch that customizes a standard exoteric rulership. These switches take three parameters: The planet to change the rulership of, the sign that it rules, and a second sign that it also rules if any.
-Y7O <obj1> <obj2> <ray1>..<ray2>: Customize object rays.
The Ray associated with each planet can be customized with this switch. The first two parameters are the low and high object indexes to change. The next parameters are the new Rays for objects within those indexes, ranging from 1 to 7.
-Y7C <sign1> <sign2> <rays1>..<rays2>: Customize sign rays.
The Rays associated with each zodiac sign can be customized with this switch. The first two parameters are the low and high sign indexes to change. The next parameters are the set of Rays for each sign within those indexes. Since a sign may be associated with more than one Ray, each setting change may be multiple digits, for example “-Y7C Cap Cap 137” will make Capricorn associated with Rays 1, 3, and 7.
-YI <obj> <string>: Customize
interpretation for object.
-YIa <sign> <string>: Customize interpretation
adjective for sign.
-YIv <sign> <string>: Customize interpretation
verb for sign.
-YIC <house> <string>: Customize
interpretation for house.
-YIA <asp> <string>: Customize interpretation
for aspect.
-YIA0 <asp> <string>: Customize aspect
interpretation statement.
You can customize the core phrases as used in Astrolog’s interpretations. All these switches take two parameters: the index of the item to change, and the string to set it to. (You probably want to enclose any strings in quotes so they are treated as a single parameter and not split at the spaces.) The things that can be changed and the switches to do them follow:
-YI <obj> <string>: This sets the meaning for the given planet or object, i.e. the part of one’s mind the planet represents. For example, the default setting for Jupiter would be: -YI 6 "enthusiastic, faithful, wise, expansive, spontaneous nature".
-YIC <house> <string>: This sets the meaning for the given house, i.e. the area of life that house represents. For example, the default for the first house is: -YIC 1 "establishment of personal identity".
-YIa <sign> <string>: This sets the characteristics for the given sign, i.e. adjectives describing it. For example, the default for Gemini is: -YIa 3 "inquisitive, witty, perceptive, adaptable".
-YIv <sign> <string>: This sets the desires for the given sign, i.e. verbs describing what something characterized by it seeks. For example, the default for Virgo is: -YIv 6 "works toward perfection".
-YIA <asp> <string>: This sets the meaning for the given aspect, i.e. the type of interaction going on when the aspect is in effect. For example, the default for the Trine is: -YIA 4 "is in harmony with". Special note: If the optional characters “%s” appear in the given string anywhere, Astrolog will replace them with an appropriate adverb indicating how strong the effect of the aspect is (and include the trailing space). For example, the real default for Trine is: -YIA 4 "is %sin harmony with”, where the “%s” will is replaced with "always ", "somewhat ", etc, as appropriate.
-YIA0 <asp> <string>: This sets the conclusion for the given aspect, i.e. an additional sentence about it. For example, the default for the Opposition is: -YIA0 5 "Adaptation is required by both sides".
-YkO <obj1> <obj2>
<col1>..<col2>: Customize planet colors.
-YkC <fir> <ear> <air> <wat>:
Customize element colors.
-YkA <asp1> <asp2> <col1>..<col2>:
Customize aspect colors.
-Yk7 <1..7> <1..7> <col1>..<col2>:
Customize Ray colors.
-Yk0 <1..7> <1..7> <col1>..<col2>:
Customize 'rainbow' colors.
-Yk <0..8> <0..8> <col1>..<col2>:
Customize 'general' colors.
Astrolog can customize the colors as used for almost anything in the program. A color may be set to any one of 16 values, represented by the numbers 0 to 15, which are: 0 - Black, 1 - Maroon, 2 - DkGreen, 3 - Orange, 4 - DkBlue, 5 - Purple, 6 - DkCyan, 7 - LtGray, 8 - DkGray, 9 - Red, 10 - Green, 11 - Yellow, 12 - Blue, 13 - Magenta, 14 - Cyan, 15 - White. When entering a color as a parameter, use the correct number above, or else type the color’s name as printed above (which may be abbreviated to the first three characters). The switches to change color settings are below.
-YkO <obj1> <obj2> <colors> switch: Colors of planets and other objects can be set with this switch, which takes at least three parameters. The first two parameters are the low and high object indexes to change. The next parameters are the new colors for objects within that range. If a color is “Element” (or the number 16), that means use the element color of the sign the planet rules (which is the default color setting for the main planets and house cusps). Note that the color “Element” will use either standard, esoteric, or Hierarchical rulers, depending on the rulership restrictions (as set with the -YR7 switch). If a color is “Ray” (or the number 17), that means use the color of the Ray associated with the planet. Note that signs will use the colors of the house cusp objects corresponding to them, e.g. the Pisces glyph and zodiac positions in Pisces will be printed in the color of the 12th house cusp object.
-YkC <col1> <col2> <col3> <col4> switch: This switch defines the colors used for the four elements, and takes four parameters, for fire, earth, air, and water, in that order. The colors used for planets are based on the element of the sign they rule, so this affects the colors of the main planets too. For example, to make earth be green and air yellow, instead of the other way around as Astrolog used to always force, do “-YkC 9 10 11 12” or “-YkC Red Green Yellow Blue” or just “-YkC red gre yel blu”.
-YkA <asp1> <asp2> <colors> switch: This defines the colors used for a range of aspects. The first two parameters are the lower and upper indexes of the aspects to modify, and are followed by one color parameter for each aspect in the range. For example, to highlight Trines by making them white and all the other major aspects dark blue, do “-YkA 1 5 dkb dkb dkb whi dkb”.
-Yk7 <val1> <val2> <colors> switch: This defines the colors of esoteric Rays. The first two parameters are the low and high Ray numbers to change, ranging from 1 to 7. The next parameters are the new colors for the Rays within that range.
-Yk0 <val1> <val2> <colors> switch: This sets a range of colors used other places in the program (excluding elements and aspects) whose default colors are one of the colors of the rainbow. The first two parameters are values from 1 to 7 indicating the lower and upper bounds of the default colors to redefine, and are followed by new actual colors to use instead. The seven indexes represent the colors Red, Orange, Yellow, Green, Cyan, Blue, and Purple. For example, if you want to change the color used for the Uranians from their default of purple to orange, do “-Yk0 7 7 orange” and you've effectively “redefined the color purple”.
-Yk <val1> <val2> <colors> switch: Like -Yk0 above this also sets a range of colors as used many places in the program, except this allows one to redefine all the standard or obscure colors (i.e. the other nine that aren't one of the rainbow colors covered above). Again the first two parameters indicate the range of colors to change which are from 0 to 8, and are followed by the new colors to use. The nine indexes represent in order the colors Black, White, LtGray, DkGray, Maroon, DkGreen, DkCyan, DkBlue, and Magenta. For example, to change the highlight color as used in graphics charts to draw borders and the like from LtGray to Yellow, do “-Yk 2 2 yellow”. (Note that you can use this to even “change” the colors Black and White to draw graphics on whatever background color you want.)
-YD <obj> <name>: Customize display name of object.
Astrolog can change the name of objects, or what string is used to display them in charts. The -YD command switch takes two parameters: The object index to rename, and the string to use when displaying it. Object names must be at least three characters long, and anything shorter will make the object revert back to its default name. Note that renaming objects only changes how they’re displayed in charts, which means command switches and such still need to refer to the object by its default name.
-YXG <0-2><0-2><0-3><0-2>: Select among different graphic glyphs for Capricorn, Uranus, Pluto, and Lilith.
Astrolog has the ability to choose between different common glyphs for various astrological symbols. One may optionally display charts with the “European” version of the Capricorn glyph, instead of the more twisty “American” type glyph. One may display charts with the “astronomical” version of the Uranus glyph using a dotted circle with an ascending arrow, instead of the more astrological “Herschel” glyph with the crescent bounded cross over a circle. One may display with the “astronomical” version of the Pluto glyph as the “PL” initials, instead of the more “astrological” version with the circle over crescent over cross. Finally one may choose to display Lilith as a small reversed crescent instead of as a circle with a line through it. The -YXG switch changes the glyphs to use for these signs and planets that may be drawn in more than one way. It takes one parameter, a four digit number specifying the glyphs to use for Capricorn (1000’s place digit), Uranus (100’s place), Pluto (10’s place), and Lilith (1’s place). For each position, the digit “0” means to leave a glyph alone, while “1” means set to what’s generally considered the “American” form, and “2” means to what’s generally considered a “European” form. (For Pluto only, one may also choose the digit “3”, which is the upward pointing arrow glyph used in esoteric astrology.) For example, “-YXG 0120” leaves the glyphs for Capricorn and Lilith at their present setting, sets Uranus to be the “Herschel” glyph, and Pluto to be the astronomical “P” glyph. The default selection is “1111”, but many astrologers East side of the Atlantic may prefer “2222”.
-YXD <obj> <string1> <string2>: Customize glyphs for planet.
Astrolog can change the glyphs used to display objects in graphics charts. The -YXD switch takes three parameters: The object index to rename, and two strings which contain the small and large definitions to use for the object’s glyph. The small definition measures 9x9 units (and is used when drawing in the small 100% character scale), and the large definition measures 17x17 (and is used when drawing in the medium 200% character scale). If the large definition is the empty string then a double scale version of the small glyph will be used for it, and if the small definition is the empty string then the default glyph for that object will be used. Glyphs are drawn in vector format by moving a pen (similar to the “draw” command in the BASIC programming language) and drawing starts from the middle unit coordinate. Strings consist of a sequence of actions, each of which starts with a character indicating how to move the pen, following by a number indicating how many units to move in that direction (no number defaults to one unit).
The action characters “U”, “D”, “L”, and “R” move up, down, left, and right. Similarly, “E”, “F”, “G”, and “H” move 45 degrees up and to the right, down and to the right, down and left, and up and left. The action prefix “B” before one of the directions means “blank”, and moves the pen without drawing a line while moving. The prefix “N” before one of the directions means “no update”, and doesn’t move the pen after drawing a line. For example, the default small glyph for Jupiter is: “BH3RFDGDGDR5NDNR2U6E”. Special case: If a definition consists of “T” then don’t do any pen drawing at all, but instead use the three letter abbreviation of the object name for display, like is done with fixed stars.
-YXA <asp> <string1> <string2>: Customize glyphs for aspect.
This switch changes the glyphs used to display aspects in graphics charts. It takes three parameters: The aspect index to rename, and two strings which contain the small and large definitions to use for the aspect’s glyph. Aspect glyph definitions work the same as with the -YXD switch used to redefine planet glyphs.
-YXv <type> [<size> [<lines>]]: Set wheel chart decoration.
This switch specifies how to decorate the corners of wheel charts. Parameter #1 is 0 for no decoration, 1 for a spider web pattern, or 2 for a Moiré pattern. Parameter #2 is optional, and indicates how far along the edge of the wheel chart the decoration extends, as a percentage from 1 to 100. For example, if this is 50 then the patterns in each corner will just touch those in adjacent corners. Note that values too high will impede display because they’ll start overlapping the wheel itself. Parameter #3 is also optional, and indicates how many lines are used to compose the spider web pattern.
-YXg <cells>: Set number of cells for graphic aspect grid.
This sets the size of the graphic -g aspect and midpoint grids, i.e. the number of cell rows and columns available to draw items in. If this size value is too high (or too many objects are restricted), there will be unused rows at the bottom, while if it’s too low (or too many objects are added), rows will be clipped off the bottom. If the grid size is set to zero, then the size to use will be the number of unrestricted objects present, and the chart will automatically resize as planets are (un)restricted.
-YXS <au>: Set radius of graphic solar system orbit chart.
The graphic solar system orbit chart (-S -X switches) covers a given amount of space measured in Astronomical Units (AU). Usually this size is automatically determined by the glyph character scale setting (-Xs switch). This switch allows one to specifically set the radius size in AU, which is useful if one wants a wider or more focused view than the default. If this size is 0, then the graphic orbit chart will be automatically sized as usual.
-YXj <num>: Set number of graphic orbit trails to remember.
The graphic solar system orbit chart (-S -X switches) allows remembering and displaying multiple locations of each planet. It allows animating the chart over time, in which each planet has a trail behind it showing its movement along its orbit. This switch determines how many positions are remembered, and each new display of the chart in which planet locations are different will append their locations to the current set of trails. The locations are stored as coordinates in space relative to the central object, which means the screen can be resized and the viewing scale changed and the orbit trails will move accordingly, however actions like switching to or from heliocentric will cause planets to appear to jump. Change this setting to 0 to turn the feature off and remove the current set of trails.
-YXj0 <step>: Set vertical step rate for graphic orbit trails.
Orbit trails in the graphic solar system orbit chart (-S -X switches) are supported in the 3D wireframe file output, and the trails will be connected lines instead of just dots in the wireframe scene. This switch allows setting the vertical offset for each subsequent section of trail. The result will be the orbit trails forming a helix instead of just a circle over time, which allows interesting animation effects such as the entire solar system appearing to move through space over time. For an example animation of this type of wireframe file, see the video: https://www.youtube.com/watch?v=jFhwfM0FKCo
-YX7 <inf>: Set influence width for graphic esoteric ephemeris.
This number specifies the width in influence units of each Ray’s column in the esoteric graphic ephemeris. For example, given “-YX7 600”, then a Ray influence value of 400 will fill 2/3 of the column.
-YXk: Use more color for sign boundaries in
graphics charts.
-YXk0: Use more color for house boundaries in graphics
charts too.
The -YXk switch will cause graphics charts to highlight zodiac sign boundaries in extra color. For example, wheel charts, solar system orbit charts, and the graphic ephemeris will have sign boundaries drawn in the color of each sign instead of always in grayscale. This also influences the display of chart spheres, and local horizon charts when 3D houses are on. If the switch is invoked as -YXk0 instead, then the 12 houses will be highlighted in extra color as well. Some may find the extra coloring makes charts stand out more, while others may find it to be too much and actually make charts harder to read.
-YXf <val>: Set usage of actual system fonts in graphic file.
This sets whether or not actual system fonts (instead of Astrolog’s vector graphics) are used for glyphs and text in PostScript and Windows metafile graphics files. Zero means no system fonts, while one means use Courier, Wingdings for metafiles, and the Astro font. (This can also be set to the hack value of two if you don't have the Astro font, which means don't try to use this system font but do use all the others.)
-YXp <-1,0,1>: Set paper orientation for PostScript files.
This allows one to set the page orientation for full PostScript graphics files as generated with the -Xp0 switch. If the orientation parameter value is positive, that means the chart will be printed in portrait mode, while if negative, it will be in landscape mode. If the orientation value is set to zero (the default), then the program will decide based on the size of the current chart, with charts with wider horizontal sizes (e.g. astro-graph charts and wheel charts with sidebars) being in landscape, and charts with horizontal sizes less than or equal to the vertical (e.g. aspect grids and wheel charts without sidebars) being in portrait.
-YXp0 <hor> <ver>: Set paper size for PostScript files.
One may also choose the paper size of full -Xp0 PostScript graphics charts. There are two parameters given which specify the horizontal and vertical size of the paper to be printed upon. By default this is 8.5" x 11". If you have say 8.5" x 14" legal size or A4 paper in your printer it can be used just as easily. Sizes may be specified in inches or centimeters. If the parameter ends in “cm” then it will be parsed as centimeters, and if it ends in “in” then it will be parsed as inches. If there’s no units, then it will be parsed based on the -Yv metric switch setting.
-YB: Make a beep sound at the time this switch is processed.
This obscure switch just sounds a generic system beep.
-0[o,i,q,X]: Disallow file output, input, exiting, and graphics.
This obscure switch is invoked in one of four forms: -0o, -0i, -0q, or -0X, where more than one of the subswitches may be combined, e.g. -0oiqX to do all four forms at once. Each subswitch disables a section of the program. The four areas of file output, file input, program termination, and graphics mode charts, may be respectively turned off by the four subswitches above. Once a section is disabled, it is that way permanently and can not be turned back on until the program quits. Attempting to access a restricted feature will display an appropriate error message or at least do nothing. This switch was meant to be used when Astrolog is being run from a chart server, as a demo, or related situation. For example, if one set up Astrolog on a network to be able to receive chart requests including arbitrary command lines where the result is e-mailed back to the user, the administrator probably wants to prevent the client from using the -o switch to create or potentially overwrite files on the server, in which case -0o can be put in the astrolog.as file to prevent file output before the client gets a chance to do anything. Similarly, -0i can be used to prevent the client from using -i to read in private files on the server. If the server only e-mails text back to the user, you probably don't want the server copy of the program going into interactive graphics mode waiting for someone to pass it keystrokes, in which case -0X can be used. Finally, -0q might be useful in demo situations where people can play with the program but you don't want them exiting it. In this last case, the only way to stop the program is to kill the process (although a Control-C should stop command line or Unix versions).
-;: Ignore rest of command line and treat it as a comment.
The -; “dash semicolon” switch when encountered causes all the rest of the switches on a command line to be ignored and not processed. This allows the semicolon (usually used by itself without the optional dash prefix of course) to be used to begin comments and for comment lines in the various command files.
Astrolog graphics screen key press options (version 6.40):
(Note: When a graphics chart is up, pressing a key which doesn't do any of the operations below will sound a beep.)
Press 'H' or '?' to display this list of key options.
Pressing this will display a help list of all the key presses available in the text screen from which the window was invoked from.
Press 'p' to toggle pause status on or off.
Press this to pause all automatic updates to the window or screen. This is mainly used to temporarily freeze any animation so a particular chart can be looked at without interruption. When animation is on but temporarily paused with this key, the mouse (inactive for the purpose of scribbling during animation) will come active again. Related to this, the number keys which set the rate of animation, but for PC’s scroll the chart when not in animation mode, will do the scrolling instead of setting the rate when animation is paused then.
Press 'x' to toggle foreground/background colors on screen.
Pressing this will invert the colors on the screen, or in other words will do the same thing as the -Xr switch on the command line.
Press 'm' to toggle color/monochrome display on screen.
For color displays, pressing this key will toggle in and out of monochrome mode.
Press 'i' to toggle status of the minor chart modification.
Pressing this key will toggle whether or not an alternate form of the present chart should be displayed. See the -Xi switch described earlier for more information on these alternate chart formats.
Press 't' to toggle header info on current chart on screen.
Pressing the 't' key will toggle whether or not the chart parameters are printed at the bottom of the window or in a sidebar. This corresponds to the -Xt switch mentioned earlier.
Press 'b' to toggle drawing of a border around the chart.
This key, when pressed when a graphics chart is being displayed, will toggle whether or not a border is drawn around the graphic. Some charts, such as aspect grids, will always have a border regardless of the state of this flag, while others such as the globes will never have one. Most charts however, such as the wheel charts will look good either way and this key can be used to choose.
Press 'l' to toggle labeling of object points in chart.
Press the 'l' key in a window to inhibit the labeling of all planets in the various charts. Instead of drawing the actual little point and then the glyph near it (as well as sometimes a line from the glyph to the dot), just the point is displayed. This mode is mainly useful for the -Z horizon and -S space charts (and has little use for anything else) when in cramped quarters or to get a more realistic view of how the sky actually looks.
Press 'j' to toggle not clearing screen between chart updates.
This key toggles on the “jet trails / time exposure” flag which will cause the graphics screen to not be cleared on new chart draws. See the -Xj switch which affects the same setting for more info.
Press 'v' to display current chart positions on text screen.
Press this key to dump back to the text screen the list of where all the planets currently being displayed in the window are. This display is the same as produced with the -v switch, and is useful if one wants text to show where everything in the chart is.
Press 'R', 'C', 'u', 'U' to toggle restriction status of minor objects, minor house cusps, Uranian planets, and stars.
Press the 'R' (restrict) key in an Astrolog graphics screen and the chart will be redrawn with the restriction status of the asteroids and other minor objects toggled. Pressing the 'C', 'u', and 'U' keys in the window will toggle the restriction status of the four minor house cusps, the Uranian planets, and the fixed stars, respectively. These keys compliment the 'R' key option and are the counterparts to the -C, -u, -U, and -RC, -Ru, -RU switches. (Note that for the 'C', 'u', and 'U' keys, toggling their state off will automatically restrict all the objects associated with them, while the 'R' key can simultaneously restrict some and unrestrict other bodies.)
Press 'c' to toggle relationship comparison chart mode.
This key, when pressed when a graphics chart is being displayed, will toggle the state of whether a relationship comparison chart (-r0) is being shown. For example, pressing it when a wheel chart is up will revert to a dual wheel chart showing two sets of planets, while pressing it when an aspect grid is up will revert to a dual aspect grid between the planets of two different charts. When going from a comparison to a single chart, one of the charts will be used while the other thrown away. When going from a single to a comparison, the same chart information will be put in both (which won't be too useful until they are made different through animation or other keypresses).
Press 's', 'h', 'a', 'f', 'g', 'z', 'y' to toggle status of sidereal zodiac, heliocentric charts, 3D houses, domal charts, decan charts, vedic format wheel charts, and navamsa charts.
Press the 's' key in the window to toggle whether or not the sidereal vs. tropical zodiac is used. Press the 'h' key to toggle to a heliocentric based chart or back again to a geocentric one. Press the 'a' key to toggle whether house placements take 3D latitude into account instead of just zodiac longitude. Press the 'f' key to toggle the status of whether or not the chart should be modified to correspond to the appropriate domal chart (where the house positions are represented as zodiac positions and vice versa). Press the 'g' key to toggle the status of whether or not the chart should be modified to correspond to a decan chart (where each sign is divided in thirds representing the two other signs in its element). Press the 'z' key to toggle whether wheel charts are displayed in Vedic format. Press the 'y' key to toggle whether charts are displayed in navamsa format or not. These keys of course correspond the -s, -h, -c3, -f, -3, -J, and -9 options, respectively.
Press 'O' and 'o' to recall/store a previous chart from memory.
Have you ever animated your natal or some other chart to some far distant future or past time, only then to wish you could somehow easily get back in time to the original chart? You can, by pressing the 'O' key in a window, which will recall to the screen previously “saved” chart parameters (which are by default set to whatever you started the window with.) Press the 'o' key to change this default stored chart to be the chart that is presently in the window.
Press 'B' to dump current window contents to root background.
Press the 'B' key in an X window to dump whatever is currently being displayed to the background root window. This is basically the corresponding keypress to the -XB option.
Press 'B' to resize chart display to full size of screen.
For PC systems, the 'B' key does a different function that the feature shown above. See PC graphics section for its description.
Press 'Q' to resize chart display to a square.
One can manually resize the Astrolog X Windows using a window manager (except when a world map or aspect grid is displayed, in which case any resizing will have no effect). Pressing the 'Q' key will automatically resize any (non-world map) window to be a square. This is useful, after resizing charts to approximately the size you want, to make them precise squares. Note that for PC’s, this will take EGA and CGA mode pixel ratios into account, in that the horizontal and vertical sizes may be made different in order that the actual display looks square. This will also take into account wheel chart sidebars and only resize the actual visible chart to a square when one is being displayed to prevent distortion.
Press '<' and '>' to decrease/increase the scale size of the glyphs and the size of world map.
This two keys will respectively decrease and increase the size of the sign and planet glyphs (as well as resize the astro-graph and aspect grid charts) through the three scale factors available. After resizing the window, you will probably want to use these keys if the glyphs are then too big or small for the new chart.
Press '[' and ']' to decrease/increase tilt in globe display.
'[', ']' keys: Not only can the globe display be rotated, but the poles can be tilted down at various angles! Press the '[' and ']' keys when the globe is being displayed to respectively “pull down” and “push back up” the angle of the polar axis from which the globe is viewed. Combining this with the globe rotation allows one to move any point of the globe to the center of the screen.
Press '+' and '-' to add/subtract a day from current chart.
These keys, when pressed when a graphics chart is being displayed, will update the current chart forward or backward one day (actually 1..9 days based on the current animation rate). When animation mode itself is active, these keys will jump by the current animation step, instead of only an amount in days.
Press 'n' to set chart information to current time now.
This key, when pressed when a graphics chart is being displayed, will change the current chart (or “outer” chart when a -r0 comparison chart is up) to the current time and place now. This interactively does the same as the -n command line switch. The only other way to revert a graphics chart to the time “now” is to enter animation mode via the 'N' key and then leave it, so this is a shortcut convenience. (This feature is only available when the TIME compile time value is uncommented of course.)
Press 'N' to toggle animation status on or off. Charts will be updated to current status and globe will rotate.
Animation: This key will toggle in and out of a mode where the chart is continually updated in the window. Entering the animation mode will cause the chart being currently displayed to be replaced by the chart for the exact moment at the time you are running the program. Every second or two, the chart will be updated to reflect the new current state of the planets and houses. For large window sizes, one can actually see very minor changes in the chart every few seconds. With the text 'T' mode in effect, the chart is basically an advanced version of xclock, and makes a good window to be left running on your display. If you are in the -XG globe display mode, pressing the 'N' key will cause the globe to rotate for an impressive display! Note that when a comparison relationship chart is up, animation will forward the chart in the “second” slot rather than the “first”. This is more intuitive when animating bi-wheel transit to natal charts, where the transiting, i.e. second, chart will be the one forwarded.
Press '!'-'(' to begin updating current chart by adding times. !: seconds, @: minutes, #: hours, $: days, : months, ^: years, &: years*10, *: years*100, (: years*1000.
These nine keys (i.e. shift plus the number keys from 1..9) enter into a different form of chart animation. Pressing them will cause the current chart being displayed (i.e. it will not revert to the current planet positions) to continually have a delta time added to it and be recast and shown. Pressing '!' will have one second added to the chart for every update (slow action unless you have a very fast system - the animation will be even slower than for the 'N' key). Pressing '@' will have one minute added to the chart each time, which makes for a nice display (note that you will definitely want to be in the text 'T' mode for these animations so you can see what times in the future these charts are being cast for. Pressing '#' will have one hour added each time (note that now the house cusps are starting to move quickly, so you may want to switch to a different system of houses (such as the Equal to keep the Midheaven from flopping back and forth) and/or use -1 to put an object like the sun on the Ascendant.) Pressing '$' will have one day added each time (now you will probably want to start using -R to remove fast moving objects like the moon), and pressing '%' will have one month added for each update of the window. The final keys, shift 6..9 cause years, decades, centuries, and millennia to be added each time, and tend to only be used to look for long range actions (such as when will Neptune next enter Pisces). To exit these animation modes, press the 'N' key.
Press 'r' to reverse direction of time-lapse or animation.
Press this to reverse the direction of any animation taking place. For the '!'..'(' animation keys above, this will cause negative times to be added to the chart, e.g. pressing '#' then 'r' on a chart cast for noon will cause the next chart to be displayed for 11am, then 10am, etc. For the Globe animation, this will cause the rotation to reverse direction.
Press '1'-'9' to set rate of animation to 'n' degrees, etc.
The nine number keys are used to set the relative “rate” of animation to “n” units. For example, normally the “@” key means add one minute to the chart for each update, but press “5” and now we are adding 5 minutes each time. For the Globe animation, by default the Earth rotates one degree each time; however, the number keys can speed this up to nine degrees for each update.
Press 'V','A','Z','S','M','K','J','L','E','X','W','G','P' to switch to normal (-v), grid (-g), local (-Z), space (-S), sector (-l), calendar (-K), dispositor (-j), astro-graph (-L), ephemeris (-E), sphere (-XX), world map (-XW), globe (-XG), polar (-XP) modes.
There are basically 13 main modes in which the graphics screen can be in: There are the nine main charts (wheel, aspect grid, local sky, space view, Gauquelin sector, calendar, dispositor, astro-graph, and ephemeris) as well as the four map displays (the chart sphere, the simple world map by itself, the globe view, and the polar projection). These 13 keys can be used to switch between these modes in the middle of program execution. For example, you can bring up your own chart in a window, then press 'L' to see the astro-graph chart for the same birth data. Then you can press 'W' to just see the world map by itself, and 'G' to see the globe view, after which you can press 'V' to return to your original wheel chart.
Press '0' to toggle between -Z,-Z0 & -XW,-XW0 & -E,-Ey modes.
When graphics are up on the screen, pressing this key acts similar to the mode changing keys above that switch between the different graphic chart types. When pressed, the state of the program being invoked with -Z vs. -Z0, as well as the state of -XW vs. -XW0, and the state of -E vs. -Ey, will be reversed. In other words, if I am viewing the -Z -X horizon chart, and I want to see the -Z0 -X sky graphic, then I press '0' to go to it. Similarly, this key will flip me back and forth between the -XW simple rectangular world map display and the -XW0 Mollewide projection graphic, as well as the -E monthly ephemeris and the -Ey yearly ephemeris. This is a quick way to change these suboptions while the program is running.
Press 'F' to toggle between world and constellation map modes.
This key toggles on the constellation charts where the map and globe modes show the celestial sphere instead of the Earth’s continents. See the -XF switch which affects the same setting for complete info.
Press 'e' to toggle display of Earth's equator in map modes.
This key toggles whether the Earth’s equator is drawn on the local horizon, chart sphere, globe, and map displays. See the -Xe switch which affects the same setting for complete info.
Press 'd' to toggle display of house information in map modes.
This key toggles whether house cusp boundaries are drawn on the local horizon, chart sphere, globe, and map displays. See the -XC switch which affects the same setting for complete info.
Press 'F1'..'F12' [plus Shift,Ctrl,Alt] to run macros 1..48.
For PC’s, pressing the function keys F1 through F12 will execute macros when graphics are being displayed. Pressing F1 through F12 will run macros 1 through 12. Pressing Shift+F1 through Shift+F12 will run macros 13 through 24. Control+F1 through Control+F12 will run macros 25 through 36. Finally Alt+F1 through Alt+F12 will run macros 37 through 48. Executing a macro that hasn't been defined yet (either with a function key or the -M switch) will do nothing.
Press 'space' to force update of current graphics display.
When a graphics chart is up on the screen, pressing the space bar will force a redraw of the chart. This is useful for say to cleanup after one has scribbled on it with the mouse button features (described below).
Press 'del' to clear the graphics screen and not redraw.
Pressing the delete key when a graphics screen is up will clear the screen, but not redraw the chart right away unless animation mode is on. This is most useful for the -Xj “timed exposure” streaks in horizon and orbit charts if you want to start a new “jet trail” while animating.
Press 'enter' to input a command line of general switches.
Pressing the return key when a graphics screen is up will pause and prompt you for a command line. This command line will be processed after which you will be returned back to the graphics state you left, allowing the changing on the fly of any setting that isn't already covered by pressing whatever key, without having to drop all the way back to a -Q loop or out of the program altogether. This can be used to redisplay the -H switch help list too. (There are a couple of rare things you can't do in the middle of graphics, e.g. you aren't allowed to suddenly switch to one of the graphics file modes.)
Press 'q' to terminate the window and program.
Pressing this key will close the window, and also exit the Astrolog program itself.
--
Left mouse button: Draw line strokes on chart
in window.
Middle mouse button: Print coordinates of pointer on world
map.
Right mouse button: Terminate the window and program.
Pressing the mouse buttons in the X Windows (or on the screen for PC’s) will do various functions. The left mouse button acts as a pen that allows one to actually draw on the chart: press it and drag the pointer to draw a line on the window - good for aiding in analysis or in presentations. (Any scribbles one makes will disappear the next time the chart window is updated, therefore this drawing is disabled in animation mode.) The middle mouse button (right button for PC’s) will only work when the world map is shown, i.e. in the -L astro-graph or -XW world map displays: press it and get the approximate longitude and latitude of the place on the map where the pointer is, printed in the main window (or have the current chart’s location set to this for PC’s). For the four scale sizes of 100, 200, 300, and 400 percent, the accuracy is to the nearest degree, 30 minutes, 20', and 15', respectively. So, if you want to cast a chart for southern Madagascar, Africa, but don't know the coordinates, click the middle button on the map for a good approximation! Finally, the right button (middle button if any for PC’s) acts just like the 'q' key, and will terminate the program.
Note that for X Windows, pressing the middle mouse button when a world map is up, in addition to displaying the longitude and latitude of the point clicked on in the parent window, will also set the current chart location to this point. This makes an easy interface for doing chart relocation! Say you want to relocate your natal chart to Tokyo, Japan. Just bring up your chart in graphics mode, press 'W' to switch to the world map display, click middle button on Japan, then return to the wheel chart and there your chart is, as if you had been born at the same time but in Tokyo.
Control keys: Certain control keys can be pressed when a graphics chart is up to set the color of the “pen” one can scribble on the chart with using the left mouse button. (Who knows, maybe Astrolog will contain a full featured drawing program someday. ;) Usually, the scribbles are always in the gray highlight color. However, sixteen control keys can be pressed to change the pen to sixteen different colors, which are defined as follows: Ctrl-A is White, Ctrl-Z is Black, Ctrl-R is Red, Ctrl-G is Green, Ctrl-B is blue, Ctrl-Y is Yellow, Ctrl-O is Orange, Ctrl-L is Light gray, Ctrl-D is Dark gray, Ctrl-V is Magenta (Valentine pink), Ctrl-U is Purple (pUrple), Ctrl-E is Maroon (Dark red, next to 'R' on keyboard), Ctrl-F is Dark Green (Forest green, next to 'G' on keyboard), Ctrl-N is Dark Blue (Navy blue, next to 'B' on keyboard), Ctrl-J is Cyan, Ctrl-K is Dark Cyan (Next to 'J' on keyboard).
The main part of the program is executed simply by entering “astrolog” (assuming that’s the name of the executable), and the program will ask you for all the birth info and will give the planet/house positions. For example, for a chart in Seattle at the Spring Equinox (for March 20th, 2018 CE/AD at 9:16am Pacific Daylight Time, 7 hours before UTC) for the ten prompts one would enter: Mar, 20, 2018, 9:16am, Y, PT, 122W20, 47N36, Spring Equinox, Seattle WA. The program then calculates and displays the positions of all planets, Chiron, the four main asteroids, as well as items like North Node and South Node of the Moon, Lilith, the Part of Fortune, the Vertex, and the East Point. (The Uranian bodies and fixed stars can also be listed if one includes the appropriate command switches.)
Two of the chart info fields interactively prompted for above are general text fields for the person’s name or chart title, and the name of the city or location the chart is cast for. When set the contents of these fields will be displayed in the various charts, such as the -v listing, the -w text wheel, and in the graphic wheel chart sidebars. (You can prevent these two fields from being prompted for by setting the -Yo old style info switch described earlier.)
Another field explicitly prompted for is whether Daylight Saving time was in effect for the chart or not. (Without this one would have to subtract one hour from the time or time zone to indicate if Daylight time was in effect, which of course was limited in that it’s not always clear whether a given chart was for say 11am Standard time, or really for noon Daylight.) As with the name and city strings, you will not be interactively prompted for the Daylight setting when the -Yo flag is active. Enter “0”, “Y”, or “S” for Standard time, and “1”, “N”, or “D” for Daylight time (or War time). An indication of Standard or Daylight time will be shown in the headers of the -v listing and in the graphics charts.
--
The user interface where one manually inputs the chart information is “smart” in various ways, as many of the chart info fields may be entered in several formats and be parsed correctly:
Months may be entered as numbers from 1 to 12 or as their true names. Case doesn't matter, and month names may be abbreviated to their first three letters.
Year values may be entered with an optional “BCE”/”BC” or “CE”/“AD” suffix. (Periods may be interspersed, e.g. “b.c.” is allowed.) Years BCE/BC may also be entered as negative years, but if you do this note that you have to add one to the negative number since there’s no formal year 0 BCE/BC or 0 CE/AD, e.g. since 1BCE/BC is followed by 1CE/AD, specifying “5BC” would be the number “-4”.
Astrolog deals with the switchover from the Julian to the present Gregorian calendar system when accepting input and printing output. The calendar system changed (at least in Europe) from the Julian to the Gregorian calendar in 1582 when October 4th was followed the next day by October 15th. Throughout the program Astrolog uses the Julian Calendar for date and leap year specification for dates before 10/4/1582 and the Gregorian after. It will properly handle the change even in the middle of months in charts, e.g. in -K calendar charts, -E ephemeris charts, -dm aspect search charts, and graphics animations, ten days will be skipped in October 1582.
Time values may be entered with a “pm” or “am” (or just “p” and “a”) suffix (periods may be interspersed), or in the standard 24 hour clock. The separator between hours and minutes should be a colon. For example, 6:30pm may be entered as “18:30” or “6:30p”. 12:30am may be entered as “12:30a.m.”, “0:30”, and so on. Time values will also parse seconds. For example, “12:34:56am” translates to 12 hours, 34 minutes, and 56 seconds. Fractional seconds can be entered, e.g. “12:34:56.78” means 12 hours, 34 minutes, and 56.78 seconds. One can still enter times like “12:34pm” without a seconds qualifier, in which case 0 seconds will be used. Fractional hours and minutes may also be entered. For example, “12:30pm” is the same as “12.5”, and “12:30.4pm” is the same as “12:30:24”.
Time zones may be entered as hours away from UTC. Positive numbers indicate west or before UTC, and negative numbers indicate east or after UTC. Numbers may also be terminated with “W” or “E” to indicate west or east or UTC. Time zones may also be abbreviation strings, such as “EST”, “PST”, and “UTC”. Note that this setting is still separate from the Daylight Time setting. In other words, strings such as “EDT” or “EWT” may be entered, but that will only subtract one hour from the time zone number, and not turn on or off the Daylight setting. Hence it may be preferred to enter strings that don't imply such an assumption, i.e. Astrolog also accepts general abbreviations such as “ET” or “PT”. For that matter, some one letter time zone abbreviations are accepted, e.g. “E” or “P” for Eastern and Pacific. When specifying half hour time zones as a number instead of using an abbreviation, the correct way is with “:30” or “.30”, since the parameter is processed as hours and minutes, and not something like “.50”, which will be treated as a fifty minute after the hour zone. (If one does interactively enter a “.5” zone, the program will display a warning indicating that the input is unusual and not a half hour zone.) Below is a table of all zone abbreviations Astrolog accepts. Listed for each zone is its official name, its standard abbreviation, its hours before UTC, and its standard meridian. For some zones the program accepts special two and one letter shortcuts:
Time Zone Name Abbrev. Hours Longitude
Hawaiian Standard Time HST HT H +10:30 157.5W
Central Alaska Time CAT +10 150 W
Alaska Hawaii Standard AHS +10 150 W
Hawaiian Daylight Time HDT + 9:30 157.5W
Alaska Hawaii Daylight AHD + 9 150 W
Yukon Standard Time YST YT Y + 9 135 W
Yukon Daylight Time YDT + 8 135 W
Pacific Standard Time PST PT P + 8 120 W
Pacific Daylight Time PDT + 7 120 W
Pacific War Time PWT + 7 120 W
Mountain Standard Time MST MT M + 7 105 W
Mountain Daylight Time MDT + 6 105 W
Mountain War Time MWT + 6 105 W
Central Standard Time CST CT C + 6 90 W
Central Daylight Time CDT + 5 90 W
Central War Time CWT + 5 90 W
Eastern Standard Time EST ET E + 5 75 W
Eastern Daylight Time EDT + 4 75 W
Eastern War Time EWT + 4 75 W
Atlantic Standard Time AST AT A + 4 60 W
Atlantic Daylight Time ADT + 3 60 W
Atlantic War Time AWT + 3 60 W
Brazil Standard Time BST BT B + 3 45 W
Brazil Daylight Time BDT + 2 45 W
West Africa Time WAT + 1 15 W
Universal Time Code UTC UT U 0 0
Greenwich Mean Time GMT GT G 0 0
Western European Time WET 0 0
Central European Time CET - 1 15 E
Eastern European Time EET - 2 30 E
Russia Zone 3 UZ3 - 4 60 E
Russia Zone 4 UZ4 - 5 75 E
Indian Standard Time IST IT I - 5:30 82.5E
Russia Zone 5 UZ5 - 6 90 E
North Sumatra Time NST - 6:30 97.5E
South Sumatra Time SST - 7 105 E
China Coast Time CCT - 8 120 E
Japan Standard Time JST JT J - 9 135 E
South Australian Time SAS - 9:30 142.5E
Guam Standard Time GST -10 150 E
Russia Zone 1 UZ1 -11 165 E
New Zealand Time NZT ZT Z -11:30 172.5E
International Date Line IDL -12 180 E
Local Mean Time LMT LT L Varies Varies
Note: The special time zone setting “LMT” allows one to do charts for times given in Local Mean Time. When encountered, the actual time zone setting will be set just so, doing the “subtract four minutes for every degree west of the time zone’s standard meridian” arithmetic, to make it work.
Longitude and latitude locations may be entered in the standard <degree><direction><minute> notation, e.g. “122W20” or “33S52”. The direction specifier may also be put at the end of the string, with a period or colon separator between degrees and minutes, e.g. “122:20W” or “33.52S”. The direction character may also be left off altogether in which case positive values indicate western and northern locations and negative eastern and southern, e.g. “122.20” or “-33:52”. Seconds can also be entered for longitude and latitude locations, in formats such as “122W19:59” or “122:19:59W”.
Note: One may also enter seconds for times and locations as fractional minutes by including more than two digits for the minute after the decimal or colon separator. For example, “122:205” will be treated as 122 degrees and 20.5 minutes west. To specify the time of 4:05am and 45 seconds, enter the time as “4:0575am”.
--
When the chart zodiac positions are displayed, by default they’re truncated instead of rounded, e.g. a position of 12Lib34 means the actual position is somewhere between 12Lib34:00 and 12Lib34:59. When the standard list of planetary positions is displayed, some additional pieces of information are shown along with the planetary locations: Whether or not each planet is in its ruling sign, or detriment, as well as the same information for houses, is shown. Planets in their exalted and fall i.e. debilitated signs and houses are noted too. In addition to the (R) indicating a planet in its ruling sign, and an (d) for a planet in detriment, we have (X) if a planet is in its exalting sign, and a (f) for a planet in its fall sign (which is always opposite the exaltation, as how the detriment is opposite the ruler).
The text listing also indicates esoteric astrology rulerships. Normally shown is whether the planet exoterically rules or is debilitated in the sign (indicated with “R” or “d” characters), and whether the planet exalts or falls in the sign (“X” or “f” characters). If the right rulership restrictions are set, also included is whether the planet esoterically rules or is debilitated in the sign (“S” or “s” characters), whether the planet Hierarchically rules or is debilitated in the sign (“H” or “h” characters), and whether the planet Ray rules or is Ray debilitated in the sign i.e. whether the planet’s Ray is the same as one of the sign’s Rays (“Y” or “z” characters). In case of multiple alignments applying, the order of priority is to show a standard exoteric rulership or debilitation, an exaltation or fall, an esoteric rulership, a Hierarchical rulership, and finally a Ray rulership.
In this main display, an element table indicating the sum of the signs in each element and mode and their totals is displayed in a grid form. Also, the total number of planets in each of the hemispheres of the wheel, as well the number of objects in yang/positive/masculine and yin/negative/feminine quality signs, are counted. To the right of the element table, we have a column of seven numbers labeled as follows: “+” is the number of “yang” objects (i.e. in Fire or Air signs); “-” is the number of “yin” objects (i.e. in Water or Earth signs); “M” is the number of objects above the horizon (i.e. in the “Southern” hemisphere of the Midheaven); “N” is the number of objects below the horizon (in the “Northern” hemisphere of the Nadir); “A” is the number of objects in the Eastern half of the sky (in the hemisphere of the Ascendant); and “D” is the number of objects in the Western half of the sky (in the hemisphere of the Descendant). Note that cusp objects are left out of hemisphere counts (but still included in the other object summaries) as they would skew things since they are always in a particular hemisphere. Finally we have a field indicating the division of objects into the first six and second six signs of the zodiac. The number of objects in the first six signs of the zodiac will be printed, labeled by the character “<“. (The number in the second half isn't printed; just subtract from the total if you want to know.) According to a book on the Kaballah, the emphasis of the first six signs on the zodiac is on “what’s to learn”, and the emphasis on the second six signs is on “what’s to share”. Use or interpret this as you wish.
I have taken the liberty to define ruling and exalting signs for the asteroids (and the rest of the first 22 objects that don't already have them.) This won't affect much other than whether a 'R', 'd', 'X', or 'f' is displayed in the -v charts, but it will slightly affect the powers given to these objects in the -j influence chart since they can be in their ruling sign, etc. The -HO object list will display the list of ruling and exalting signs (and the detriment and fall signs which are just opposite the above) for all these objects in addition to the planets; however, I have listed them below:
Chiron, the compassionate, experienced healer, is most similar in function to Pisces, hence Chiron rules here. Chiron expresses well in caring, feeling, Cancer, hence Chiron exalts here. Ceres, goddess of agriculture and representing the mothering, reproductive instinct, is similar in function to Taurus, hence Ceres rules here. Ceres expresses well in the nurturing, caring, sign of Cancer, hence Ceres exalts here. Pallas Athena, mentally acute and unemotional, is most similar in function to Virgo, hence Pallas rules here. Pallas expresses well in practical, disciplined, introverted Capricorn, hence Pallas exalts here. Juno, ability to sacrifice self-interests to maintain a relationship, is most similar in function to relationship oriented Libra, hence Juno rules here. Juno expresses well in sociable, crowd pleasing Leo, hence Juno exalts here. Vesta, with its orientation to directing hidden creative or sexual energy without fear, is most similar in function to Scorpio, hence Vesta rules here. Vesta expresses well in individualistic, quirky Aquarius, hence Vesta exalts here.
The North Node, with its emphasis on being able to break from the past routine and pursue the unfamiliar and personal growth, is most similar in function to society questioning independent Aquarius, hence it rules here. The South Node’s ruling and exalting signs are set to be respectively Leo and Sagittarius, i.e. the opposite of the North Node’s. The Part of Fortune is calculated based on the positions of the Sun, Moon, and Ascendant; if these three objects are in their ruling signs, then the Fortune will fall in Pisces, hence the Fortune should rule here. Similarly, if the Sun, Moon, and Ascendant are all in their exalting signs, then the Fortune will fall in Aquarius, hence the Fortune should exalt here. The Vertex, being always near the Descendant, corresponds to Libra, and hence has the same rulership and exaltation as Venus: Libra and Pisces. The East Point, being always near the Ascendant, corresponds to Mars, and hence has the same rulership and exaltation as Mars: Aries and Capricorn. Lilith has the rulership of Scorpio and exaltation in Pisces. House cusps and angles rule the sign corresponding to them, e.g. Aries for the Ascendant, Taurus for the 2nd Cusp, and so on. House cusp objects exalt in the next sign of the same element beyond the one they rule, e.g. Aries exalts in Leo.
Each Uranian also has been assigned its own ruling and exalting sign, meaning Uranians in their rulership, etc, will be flagged as such and have more or less influence and so on. I also came up with these myself and used the interpretation strings to decide what the most appropriate signs are. If you prefer other signs or no sign at all for any of the rulerships, you can easily change them using the -YJ switch described elsewhere. Specifically, Cupido rules Libra and exalts in Gemini, Hades rules Scorpio and exalts in Virgo, Zeus rules Leo and exalts in Aries, Kronos rules Capricorn and exalts in Sagittarius, Apollon rules Sagittarius and exalts in Aquarius, Admetos rules Virgo and exalts in Scorpio, Vulkanus rules Aries and exalts in Leo, and finally Poseidon rules Sagittarius and exalts in Pisces.
The standard chart listing of the planetary positions will also include an additional field for the “velocity” of each planet. This velocity value approximates how fast the planet is moving through the zodiac with respect to the Earth (or whatever the central body is set to) in degrees per day. This value of course, goes negative when a planet goes retrograde. This is useful not only to get a feel for how fast each planet moves through the zodiac, but to determine when a planet is about to go retrograde or direct - the value approaches zero when the planet changes direction.
Astrolog includes the ability to search an input file for various default settings to use in the program. This allows one to easily change major defaults without having to recompile the program, which is useful if, say, one receives a compiled executable from a friend who has a different configuration. The program looks for the file astrolog.as in the current directory, and if not there, looks for it in the default directory (and in directories indicated by environment variables if set). Parameters in this file will override any defaults compiled into the program, although the highest priority is still given to the command line options. Note one doesn't have to have this file in order to run the program - if not found Astrolog will still run as before using compile time defaults.
Astrolog configuration files from versions 4.10 and before (which were named “astrolog.dat”) won't work with the current version, because like the chart info files, the astrolog.as file is also a series of command switches (see below). The fixed fields used in version 4.10 and before no longer exist, since there are command switches to do the same things as everything the old files could set and a whole lot more. Attempting to use any old astrolog.dat file will cause the program to complain that it’s not in any valid format. If you have an old file, delete it and modify the one included with this release to correspond to your desired settings. Version 4.20 through 6.30 config files are however fully compatible with 6.40 and don't need to be changed.
--
As of Astrolog version 4.20, all files are a series of command switches that indicate the contents of the file and set the appropriate things when executed. This is very powerful, extendable, and general. Astrolog still has the ability to read and write the old chart formats. This affects -o chart info files, -o0 chart position files, and the astrolog.as config file. In a sense there is no difference between the three formats, just they are generated or read in for different situations. Whenever any chart is read in, Astrolog simply reads in the file a line at a time and processes the switches as if they were on the command line or entered in a -Q loop.
The astrolog.as config file is one of the files that is a series of command lines. This change makes the astrolog.as file much more powerful and versatile than it would be otherwise. The file is not in a fixed format with fields that have to be in a certain order. You can move lines around, add as many lines as you want, or take lines out without problem. These config files shouldn't become out of date in future versions of the program either. Incompatibilities will only arise if the syntax of a switch changes, and even then it’s obvious as to the small correction that needs to be made. It’s important to remember that any switch can be put in the astrolog.as file. For example, you can change the default behavior of the program when invoked without any switches, by say putting “-n” in it, to make the program always display the chart for now unless you specify otherwise. You may want to put “-C” in it if you want the house cusps to always be included in transit and other charts. If you are always doing graphics charts, you can put “-X” in there somewhere so you don't have to put it on the command line. Long or complicated switches like new planet definitions, and color or interpretation customizations, are good candidates to put in astrolog.as so they don't have to be retyped all the time.
The file as generated with the -o switch is also just a couple of command lines to set the chart information appropriately. (Before version 4.20, the older file format hadn't changed a bit since files where first introduced in version 1.20!) Note that you can manually add additional switches to any chart info file, to have per chart settings. For example, if you are always displaying a particular natal chart’s aspect grid, you can put a “-g” in that particular file so you don't have to include -g on the actual command line with the “-i file”. (Or you can put the “-g” in the astrolog.as file and have all charts come up by default in the aspect grid instead of the -v listing.) Note also that the -i switch is technically a generic command file reader. You can read any switch file with -i, and even reload the astrolog.as defaults with a line such as “-i astrolog.as”.
Since -i will read in and process any command file, you can make your own arbitrary command files and read them in whenever you want. You aren't limited to modifying just chart info files and astrolog.as. Say you like to use a narrower set of orbs for transits. You can make a special file that just sets a bunch of orbs using the -A switches, and then read it in via “-i narroworbfile” and combine it with -t or whatever. Note that command files can even process other command files inside of them. Remember that astrolog.as is just a special command file; the program basically just does a “-i astrolog.as” internally on startup.
-@ switch: All Astrolog switch files must begin with the '@' character, which identifies them as such. The switch files as generated with -o and -o0, and the default astrolog.as file, have a couple numbers immediately following the '@' which indicate the file type and version, included for potential backward compatibility issues in the future. (For those interested, the first two digits indicate file type, in which “01” is a -o chart info file, “02” is a -o0 chart position file, and “03” is a configuration file like astrolog.as. The second two digits indicate file version: Chart info files are “0103”, because version 1 of a chart info file was the pre-version 4.20 form, and version 2 was the pre-version 6.00 form. Chart position files are “0204” because version 3 was the pre-version 6.00 form, version 2 was the pre-version 4.20 form, and version 1 was the pre-version 3.10 form. The astrolog.as file is “0309” because versions 1-7 were all the different old fixed field versions of this dating back to when the config file was first introduced, and version 8 was the pre-version 6.00 instance of it.) Note that the '@' happens to technically be a switch too, but is only dealt with internally by the program. If you make any of your own command files to read in with -i, just be sure there is a '@' character (better yet the sequence of characters “@0309” to be like the default astrolog.as) at its very beginning and everything will work.
Chart position files as generated with the -o0 switch are much improved over the format used in versions 4.10 and before. The zodiac positions have an extra two digits of precision and the declinations have an extra one digit. The newer files include the velocity of the planet and its distance from the sun, so applying vs. separating aspects and -S orbit charts work perfectly. (Before the data would be lost.) These files may also include star positions unlike before, and are more complete with respect to house cusps. The actual house array is kept separate from the cusp object indexes, meaning that one for example can reload charts in the Equal house system that disassociate the Midheaven from the 10th cusp and remember both positions, and even save a -r synastry chart with -o0 and remember both sets of house cusps on reload.
-YF switch: As -o0 position files are a series of command lines, there is a switch to set the actual positions of a planet. This is the -YF switch which takes eight parameters, which are: the index of the object to set the positions of, the degree within the sign of its position, the zodiac sign of its position, the minute within the degree of its position, the degree of its ecliptic latitude, the minute within the degree of the latitude (which should always be positive, e.g. for a latitude of -10.5 degrees, the parameters would be -10 and 30), the velocity in degrees per day (positive is direct motion, negative retrograde), and finally the distance from the Sun or central body in AU. This switch shouldn't really be used outside of -o0 files as it causes the chart to be assumed to have no time or space, but is described here for completeness. Note that another advantage to the newer -o0 files is that you can again add other switches to them (e.g. “-s” to indicate if it’s a position file for a tropical or sidereal zodiac chart), and rearrange or delete lines without problem, unlike the older -o0 files which required all the planets and in a fixed order.
Here’s an example of one of the switch based command files, specifically a modern chart info file with the name, city, and Daylight fields in it. This is much easier to understand and modify than older files, and is the info for my own natal chart consisting of the three lines below:
@0103 ; Astrolog chart info.
/qb Nov 19 1971 11:01am ST +8:00 122:19:59W 47:36:35N
/zi "Walter D. Pullen" "Seattle, WA"
--
Astrolog has several environment variables which may be set to indicate directories where to find the various files it may look for. Without them, the only place the program will look for chart files, the astrolog.as initialization file, and ephemeris files is in the current directory and default directories set at compile time. The program will look where all of these environment variables point, if they are defined. The three environment variables are named “ASTROLOG”, “ASTR6.40”, and “ASTR”. On a PC you can set an environment variable from the DOS prompt with a command such as “set ASTROLOG=C:\PROGRAMS\ASTRO610\CHARTS”. This command can be put in your AUTOEXEC.BAT file to remain persistent. On a Unix system you can set an environment variable from the shell with a command such as “setenv ASTROLOG ~username/programs/astro610/charts”. This line can be put in your .cshrc file to remain persistent. Note that the ASTR6.40 environment variable is version specific, i.e. the previous version looked in one called ASTR6.30 instead. This allows one to have a directory for version specific files such as the astrolog.as file, and have multiple versions of Astrolog on the system at once without them conflicting with each other. (Note that Unix systems running the ksh shell apparently don't accept variables like ASTR6.40 with periods in them, but they will accept the other two.) I personally point ASTROLOG to my chart files directory, ASTR6.40 to my astrolog.as directory, and ASTR to my ephemeris directory, although any file may be found with any of the variables. Specifically, when Astrolog searches for a file, it will look in the following directories, in order: The current directory, the ASTR6.40 environment variable directory, the ASTROLOG environment directory, the ASTR dir, and finally the compile time default directory.
--
Some systems (for example, Mac’s) don't directly accept parameter switches on the command line (such as Astrolog is being booted from a menu.) Therefore, such a limitation makes one unable to access many program features in the normal way. If this is the case with your system (or if you just don't like command line options), then comment out the '#define SWITCHES' line at the beginning of the astrolog.h file. If you do this, then the program will ignore any switches and prompt you to enter them manually at the very beginning of program execution. You just enter one line containing all the parameters together, separated by one or more spaces, just like is done when typing in the command line, or when in the -Q loop mode. Astrolog will automatically parse the string and extract the parameters, just like the operating system shell does.
Related to this, the “-.” switch, when encountered on a command line, will immediately terminate the program, ignoring any modes or other command switches. This is the formal way how to really exit the program when in the -Q loop (and really only useful in this case). Remember, earlier it was said to enter “.” for the command line to exit the -Q mode. Astrolog internally interprets the “.” as a switch without a leading dash, i.e. “-.”, which is a switch that will force program termination.
--
I often use Astrolog to look at and compare files containing charts of various people. I have many chart files, so I keep them in a separate directory. Since it is always a pain to have to cd into this special directory all the time, there is a DEFAULT_DIR string to be set at compile time. Whenever the program reads in a chart file with the -i option, it will first look in the current directory for it. If it’s not found there, Astrolog will then look for a file of the same name in this special default directory (and in directories indicated by environment variables if set).
A couple of other compile time option variables are in the include file astrolog.h: For those people who don't like Placidus, a default house system can be set by changing the value of DEFAULT_SYSTEM to the value from 0 to 11 indicating what system to use if the user doesn't explicitly specify one with -c or in astrolog.as. A few other compile time options are in astrolog.h which can be used to leave out certain parts of the program which you don't desire to have or just take up memory and make the executable larger. The #define INTERPRET can be commented out to remove all the -I interpretation routines and tables. The #define BIORHYTHM can be commented out to remove the non-astrological -rb biorhythm text and graphical charts. And the #define CONSTEL can be commented out to remove the -XF constellation graphics and -HF text constellation list. Finally, concerning the source code itself, all of Astrolog’s functions have full Ansi prototypes, which can be turned off for older compilers by commenting out the PROTO #ifdef.
There is a special compile time variable dealing with graphics (in addition to the “X11” and “WIN” ones) called “GRAPH”. One comments out the #define GRAPH line if they don't want any graphics at all, and not just if they don't have X windows or PC screen graphics. In other words, one can generate most of Astrolog’s graphics charts even if they don't have X windows or a PC with graphics abilities. When GRAPH is defined, but X11 or WIN aren't, the program will generate the charts, but just never try to bring up a window; it will simply always assume that you are writing a bitmap file. The bitmap file will contain a (unfortunately always black and white for the X bitmap format) image of what would normally be in the window, just as the -Xb switch does. One can then use various graphics utilities to convert the image into something they can display on their system if they can't do so using any of the available bitmap modes. (Any system that can compile Astrolog should be able to compile in all the non-screen graphics features as well.)
A bitmap output mode other than the Windows .bmp bitmaps and standard ones that can be read with the Unix X11 xsetroot command is allowed in the graphics routines. If one changes the BITMAPMODE compile time option in astrolog.h to the character 'A' when compiling, or invokes the -Xb switch as -Xba, then all bitmaps output will be in a straight Ascii form, with one character corresponding to each pixel. This format is identical to the result produced by the Unix command bmtoa (when the chart is monochrome), and it can be converted back into a bitmap with the Unix command atobm. Although not as efficient spacewise, this is a simpler format, and is recommended for those without screen capabilities who still want to use Astrolog’s graphics, if they want to write their own conversion program.
One of the most impressive features of Astrolog are its graphics features available for X windows, which are generally accessed in the program via the -X switch and derivatives of it on the command line. There are seven different types of chart displays: A standard graphic display of a wheel chart in a window (with glyphs, aspects in the center, etc), graphic displays of the Astro-graph charts (which look almost identical to the Astro*Carto*Graphy maps from Jim Lewis) complete with all the labeled lines drawn on a map of the world (like the -L option), aspect/midpoint grids showing the aspects and orbs in effect between every body in a chart (like -g option), a local sky chart showing where each planet is located on a map of the local horizon area (as in -Z), a space chart showing an aerial view of the solar system (as in -S), a dispositor graph chart showing planetary rulership chains (accessed with -j), and a graphic ephemeris plotting position vs. time (as in -E), in addition to a couple of non-astrological charts such as calendar (-K) and biorhythm (-rb) graphics. The X wheel and aspect grid charts can also displayed in a different manner to accommodate relationship comparison charts showing two sets of planets at once. There are also other commands that can be given to the window once it is up and running, which can do other things, such as continually update the window every few seconds to the current status (i.e. an extended version of the -n option) as well as other forms of animation. Note that the program is still text based, and one can turn off all the X features by commenting out the #define X11 in astrolog.h if they don't have X windows.
Probably the only thing more impressive than the graphics features are the graphics features displayed on color monitors. Here is how the colors have been assigned for the various charts: Four colors have been allocated for the four elements which by default are: Fire = Red, Earth = Brown, Air = Green, Water = Blue. The various sign glyphs (and the corresponding house labels) are in the color of their element. Planets are in the color of the sign of their main ruler. Chiron and the four asteroids are Pink, while the North Node, and other non-physical objects like the Part of Fortune and Vertex are Blue Grey. Representations of the Ascendant/ Descendant/ Midheaven/ Nadir (in the astro-graph map lines and elsewhere) are in the element color of the corresponding sign/house that the angular lines refer to, i.e. Ascendant = Red, Midheaven = Brown, Descendant = Green, Nadir = Blue. A few extra things have been added for color wheel charts only: dark gray lines marking off each house (in addition to the main lines on the horizon and meridian), and each degree instead of every 5th degree being marked in dark gray on the outer circle (every 5th degree being white). Aspects lines are colored too, as follows: Conjunctions = Yellow, Sextiles = Light Blue, Squares = Red, Trines = Green, Oppositions = Dark Blue. For the minor aspects we have: Inconjuncts/Semisextiles = Pink, Semisquares/ Sesquiquadratures = Orange, (Bi/Semi)Quintiles = Blue Grey, (Bi/Tri)Septiles = Maroon, (Bi/Quatro)Noviles = Violet.
For color terminals, the -XG globe display and -XW world map display are done with the continents in different colors, also making them look much better than monochrome maps. Each of the seven continents is in a different color of the rainbow, and the colors are chosen to correspond to the appropriate chakra (etheric energy vortex along the human spine) that goes with each land mass. They are: Africa - red - Root chakra, Australia - orange - Navel chakra, South America - yellow - Solar plexus chakra, North America - green - Heart chakra, Europe - blue - Throat chakra, Asia - indigo - Third Eye chakra, Antarctica - violet - Crown chakra. Lakes within continents are colored dark blue.
--
-v -X: The graphic wheel charts have their graphic information organized as follows: There’s an outer circle showing the signs and sign glyphs, inside of which is a smaller circle divided up into 5 degree increments to make determining exact degrees easier. Inside of this is a circle divided up into the 12 houses labeled with numbers. The entire chart is divided by two dashed lines through the Ascendant/Descendant (which is always horizontal of course) and the Midheaven/Nadir. Inside the house circle are the planet glyphs in their appropriate positions. Small pointer lines run from each glyph to just before single dots. These dots indicate the precise locations in the zodiac of each object. The pointer lines (which are dashed if the object is retrograde and solid otherwise) are necessary so as not to have to draw planet glyphs on top of one another when planets are conjunct. Inside the ring of the single dots, are the aspect lines connecting these positions. Since the default number of aspects to use is just the 5 majors, one can determine which aspect is in place just by looking at the aspect line. The accuracy of the aspect is determined by the dashedness of the line: A solid line means the orb is < 2 degrees; a dashed line means the orb is 2 to 4 degrees; a really dashed line mean the orb is 4 to 6 degrees, and so on.
-v0 -X: Astrolog’s wheel charts will be labeled more extensively than just having the chart header information displayed at the bottom of the graphic like in other chart modes. The wheels will include full information on time, place, the chart’s name and city fields if defined, house system, zodiac, central planet, element table info (including the count of objects in angular, succeedent, and cadent houses, and the count of objects in the first six “learning” signs and the last six “sharing” signs), as well as the actual positions of house cusps and planets as displayed in the wheel. All this information is in a “sidebar” to the right of the wheel which includes a listing not unlike the -v text chart. (Note that the size of this sidebar is such that for the default 480x480 pixel chart size, including the sidebar will make it 640x480, which perfectly fills a VGA PC screen.) This sidebar supports relationship charts involving two or more charts, and for a relationship chart will list both sets of chart information (or all three or four sets in the case of tri and quad wheels). Each set of chart information will be properly labeled, such as synastry chart sidebars will indicate which set of chart information is determining the houses and which the planets. If you want a simpler style wheel with just the chart information at the bottom of the graphic, set the -v0 flag, as in “-v0 -X”, instead of “-v -X” or just “-X”.
-w -X: A different way of formatting the graphical wheel charts described above is available by combining the -w switch with -X. Normally all of Astrolog’s wheel charts are such that each zodiac sign is the same size. Due to different house sizes in most systems however, this makes the houses appear different sizes on the wheel, so that the Midheaven won't be the exact top of the chart for instance. Some users may instead prefer “house oriented” as opposed to sign oriented wheel charts. Astrolog, with the -w -X combination, will make each house be the same size on the screen, and will compress or expand the signs instead (of course this means that such things as exact squares may not be between objects exactly 90 degrees apart on the circle any more). When graphics are displayed on the screen, the '0' key will toggle between the two forms of wheel chart.
-L -X: The graphical astro-graph charts are organized as follows: A map of the world is shown. The edges of the map are labeled with ruler lines that are 5 degrees apart (with longer ruler lines for more important longitudes and latitudes, like those that are multiples of 10, 30, etc.) The equator is labeled with a dashed line. The polar regions of the world aren't shown; the map shown ranges from 60 degrees S latitude to 75 degrees N latitude. Note that each pixel on the screen represents exactly one half a degree on the world. (For -Xs 100 the ratio is one pixel to one degree, and for -Xs 400 the ratio is one pixel to 1/4 degree.) On this map are drawn the lines indicating where on the world the various planets are angular at the time in question. (Note: you might want to -R restrict some objects because otherwise the map tends to get pretty cluttered with lines.) As expected, Midheaven and Nadir lines are vertical, and the Ascendant and Descendant lines are curved. Little square boxes on the Midheaven lines indicate the exact zenith latitude location. Each line is labeled at the top or the bottom of the screen, showing what planet is in question and (sometimes) what angle is in question. All Ascendant and Midheaven lines are labeled at the bottom of the screen, and all Descendant and Nadir lines are labeled at the top. Each line goes a bit beyond to the top or bottom of the world map, and then another pointer segment (which is again dashed of the object in question is retrograde) goes and points to the planet glyph. The glyph for the Ascendant or Midheaven is under each of the glyphs at the bottom of the screen, explicitly indicating whether the line is an Ascendant or Midheaven line. At the top of the screen, however, there are only the glyphs, but one can still determine whether these lines are Descendant or Nadir lines based on whether they are curved or not. Note that not all the Descendant lines are labeled; this is because some of the Ascendant/Descendant lines actually connect near the top of the screen and don't actually cross it. This graphic astro-graph chart will display a small purple dot at the precise point on the world map for which the chart in question is being generated. This is useful to help see how close the various planetary lines are to you, if you live in the middle of the continent or someplace not easily determinable on the compact map of the world.
-L0 -X: Graphic astro-graph charts will be done slightly differently if done by combining -L0 with -X. A thin horizontal line will be drawn all across the map of the world at the latitude of the chart in question. Normally, there’s only a small dot at the precise location. In astro-graph charts, intersections between lines anywhere at the same latitude of a natal chart, even if any number of degrees away longitudinally, will affect the person, in the same way but not as strong as if they are directly under the intersection itself. This small chart modification can make finding such intersections easier in the graphics chart, just as -L0 for text charts actually lists the latitudes of all crossings.
-g -X: Aspect grid graphics with the appropriate aspect glyphs can be displayed by combining the -g option with the -X option (astrolog -g -X). Both the split aspect/midpoint grids labeled down the diagonal, as well as the relationship aspect grids between two charts (astrolog -r0 <file1> <file2> -g -X) are supported. The aspect glyphs, objects, and the signs in the grids are in their colors as defined earlier. Like the astro-graph windows, these charts can't be resized in the normal way unless one uses the '>' and '<' keys. For anything less than the larger scale sizes (achieved with the switch -Xs 300, or by pressing '>' within a window) all that will be displayed in each aspect grid cell is the glyphs of the aspect in effect, the planet being aspected, or the sign of the midpoint. However, once the largest scale size is reached, there is room in each cell to display the aspect orb to the nearest minute off of exact (with a plus or minus sign indicating whether the actual angle is slightly greater than or less than exact, or an 'a' or 's' if applying vs. separating orbs are to be shown instead); the degree and minute in addition to the sign for midpoints; and the degree and sign location for each planet that’s in the grid, as with the -g text charts. This chart will show the nearest arc second of orbs and midpoints when the -b0 print nearest second setting is on, and when the -Xs character scale factor is 400 (so that there’s enough room to include seconds).
-m -X: Combining the -m switch with -X will have the same result as -g with -X, since the aspect grid shows both aspects and midpoints separated by the grid diagonal. However, doing a relationship midpoint chart (-r0 -m -X) will result in the relationship aspect grid coming up but showing the midpoints instead of aspects, as desired. The -r0 -m -X switch combination implicitly does the results of the -g0 switch, which for relationship charts puts midpoints instead of aspects in the grid.
-Z -X: The -Z local horizon feature can be displayed in an X window as well (e.g. astrolog -Z -X), in which all the planets will be displayed in a window depicting the sky. The small dot above or below each glyph indicates exactly where each planet is. (Some of the glyphs may be overlapping, although the program tries to cut down on this.) There is a horizontal line dividing the window representing the local horizon; planets above this line are visible, while planets below it are set. There are three vertical lines dividing the window as well: The middle line represents the due south direction, the one to the left is due east, the one to the right is due west, and the edges of the window are due north. (These directions are labeled in the borders of the chart.) Like the standard chart display, this window or graphic may be resized to any proportion. At any time one can press the 'Z' key when a graphic is up to enter this display type in that window.
-Z0 -X: An additional graphics chart is available through the -Z0 switch: local horizon charts suitable for stargazing. The normal -Z switch generates a listing of the planets with respect to the local horizon, and the -Z combined with the -X switch generates a graphic image of the planets and stars on the local horizon. That chart assumes one is facing due south, and is divided left to right by the horizon line, with straight up being toward the top of the screen and straight down toward the bottom. That is a good chart, especially for noticing the rising and setting of planets and other objects, but the fact that the meridian is split up causes distortion when trying to view objects high up in the sky. Therefore, if one combines this -Z0 switch with the -X switch, a differently oriented local horizon chart will be displayed. Here, the zenith point straight up is in the center of the screen, and the horizon line is a surrounding circle. Due north is along the line from the center to the top of the screen, due south is on the line from the center to the bottom, east is to the left, and west is to the right. In other words, this is just like what one would see if they were lying on their back looking straight up with their feet to the south, so this should be better for stargazing. Outside the circle marks what’s below the horizon, and the extreme corners of the screen mark the nadir or what’s straight down. All points below the horizon are compressed to fit between the horizon circle and the outer boundary square, allowing all points in the sky to be visible. As with the normal -Z graphic chart, this one has the various axes marked at five degree increments.
-S -X: The -S switch can be combined with -X to give a graphics chart of the solar system. This will be displayed as an aerial view of the entire solar system, with 0 degrees Aries to the left of the screen, 0 degrees Cancer to the bottom, etc. Whatever object is chosen to be the central body is at the center of the screen, with all the others around it. This is a fun chart to animate, in that one can watch the planets orbit around the Sun, and see how they turn retrograde with respect to the Earth. In addition to the bodies themselves, twelve spokes are drawn from the center body to the edge of the chart, which delineate the zodiac with respect to it. This chart will also label the zodiac signs, with sign glyphs around the outside edge of the chart. These glyphs and the lines to mark the sign boundaries can be toggled with the show house details setting (-XC switch). This chart can also display aspect lines between the planets. The aspects present will be with respect to the central body, and will be the same aspects as seen in the aspect grid or in the middle of a wheel chart. The display of these aspects can be toggled with the show equator setting (-Xe switch).
Note that the scale of the solar system is large, which means attempting to fit all the planets out to Pluto on the screen at once will cause all the inner planets to be crammed together near the middle of the screen. To deal with this, the scale size as indicated with the -Xs switch and the '<' and '>' keys will affect how much of the solar system is viewed at once (in addition to controlling the glyph sizes). For a scale size of 100, the viewing region will have a wide radius of 90 AU, enough to easily include the entire solar system, as well as the orbits of the hypothetical Uranian bodies beyond Pluto. For the default scale size of 200, it will have a radius of 30 AU, enough to include Neptune (and Pluto most of the time). For a scale size of 300, the viewport will have a radius of 6 AU (about out to the orbit of Jupiter, which is useful for viewing the inner planets). Finally for a scale size of 400, the viewing region will have a radius of 1 AU (just enough to cover the Earth’s orbit). At a 400% scale zoom with the Moon included as well, one can actually get a feel for the relative distance of the Sun from the Earth and the Moon from the Earth, although the chart will have to be over 1000 pixels wide for the Moon to even appear one pixel away from the Earth! If the scale size is 400, and the -XS graphic text scale is set to 200 or larger, then the viewing region will be a very small 0.006 AU, which is just large enough to fit the Moon’s orbit, so works well with geocentric or Moon object centered charts, to see the motion of the Moon, Nodes, and Lilith around the Earth. Note that if the -b ephemeris files setting is off, then Earth’s Moon will be left out.
-l -X: The Gauquelin sector chart may be displayed in graphical form by combining the -l switch with -X, where the 36 sectors will be arranged in a wheel, with chart header info displayed at the bottom or in a sidebar as with regular wheels. Each planet will be plotted at its appropriate sector location, with plus zone sectors labeled in red and minus in dark green, and aspects will be indicated in the middle of the wheel. This chart also has the plus or minus zone status of each sector indicated by a small plus or minus sign around the outside border of the wheel. The sidebar in this graphic Gauquelin sector wheel chart will to the right of each planet position show the sector number the planet falls in. (Normally this is just the glyph for the object in question like it is for the other wheels.)
-j -X: Graphic dispositor charts are available by combining the -j influence switch with -X. This is a another graphics chart format that can also be switched to whenever screen graphics are up by pressing the 'J' key. The dispositor of a planet is the planet that rules the sign it’s located in. For example, if you have Venus in Aries, the dispositor for your Venus is Mars. A graph can be made showing an arrow from each planet to its dispositor. A final dispositor is a planet who is its own dispositor, i.e. in its ruling sign with no arrows pointing away from it. There can also be two planets in what’s called mutual reception (or a reception loop of more than two) if they are each other’s dispositor, e.g. Venus in Aries and Mars in Libra. Astrolog’s dispositor chart will show four subgraphs, one in each quadrant. Both a sign dispositor graph, as described above, and a house dispositor graph, where each planet is linked to the planet ruling the house it’s in, are shown. In addition, both types have the same information displayed in two different useful formats: a wheel with the planets around the perimeter, and in a hierarchy with final dispositors at the top and the other planets stacked based on how many levels they are from final ones. Final dispositors are circled in white, while those in reception loops are circled in gray, and dispositor arrows within the top level (i.e. in reception loops) are in white too instead of the color of the planet for easy identification. For a demo of the dispositors in your own chart, do “astrolog -i yourchartfile -j -X”.
This chart normally graphs standard rulership dispositors. However, if standard rulerships are restricted (-YR7 switch) and esoteric rulerships aren’t, then it will instead graph esoteric rulerships. If esoteric rulerships are graphed, then the chart will include Earth and Vulcan (which means Vulcan should be unrestricted so its position isn’t 0Aries), for 12 planets instead of 10 in the chart. If both standard and esoteric rulerships are restricted and Hierarchical rulerships aren’t, then this will instead graph Hierarchical rulerships.
-7 -X: A graphical ephemeris of esoteric Ray influences is available by combining the -7 esoteric chart switch with -X. This chart is effectively the Ray power values in the -7 switch text mode chart graphed over time. The seven Rays and their powers (and average power) are listed on the horizontal axis, and time on the vertical axis. If the modify chart setting is on, this chart will graph an entire year instead of just a month. If the -Xi alternate display mode is on, it will graph the “slice” power of each Ray instead of the “count” power. If the -Xl show glyph labels setting is on, this display will have a horizontal line drawn across the chart indicating the day and time in question, to make it easier to see where in the month or year the chart time actually is. The -YX7 <num> switch specifies the width in influence units of each Ray’s column in the esoteric graphic ephemeris. For example, given “-YX7 600”, then a Ray influence value of 400 will fill 2/3 of the column.
-K -X: Graphic calendar charts are available by combining the -K calendar chart with -X. This is another graphics format that can be switched to whenever screen graphics are up by pressing the 'K' key. This shows a calendar for the month of the current chart, like the corresponding text chart but in graphic format with boxes for each day like a real calendar. The current day within the month will be highlighted in green (if the -Xl label inhibitor flag isn't on). The -Xi alternate display mode will put the date numbers in the middle of their box instead of in the upper left corner. Finally the -Xt chart info display flag for this particular chart will control how the date numbers are justified in their box. The -Ky yearly calendar switch may be combined with -X switch to generate a graphic calendar for the entire year. When the graphic calendar for the year is drawn, the 12 individual months will be arranged in either a 2x6 grid, a 3x4 grid, a 4x3 grid, or a 6x2 grid, based on the dimensions of the chart; for example, a square chart will be drawn three months across by four down, but a tall skinny chart will cause the calendar layout to be in a 2x6 grid.
-E -X: A graphical planetary tracking chart is available by combining the -E switch with -X. This “graphical ephemeris” will display the sign degrees of the zodiac along the horizontal axis, and the days in the given month along the vertical. The positions of the planets at each day (at the time and zone from the current chart) are then graphed. The result is a bunch of wavy lines that make it easy to see all the planetary movements during the month. Wherever lines cross there’s a conjunction on the day indicated on the axis at the same level as the crossing. Although this only looks at the month in the given chart information, the actual day will be highlighted on the vertical axis. Combining the -Ey yearly ephemeris instead with -X will generate a graphical ephemeris showing the movements for the entire year, with the months labeled along the vertical axis. In the -r0 relationship comparison mode, this chart will have in addition to the standard ephemeris lines for the first chart, dashed vertical lines drawn at the positions of the planets in the second chart, at the time the ephemeris is done for. If the -Xl show glyph labels setting is on, this display will have a horizontal line drawn across the chart indicating the day and time in question, to make it easier to see where in the month or year the chart time actually is.
If the -gp or -ap parallel aspects setting is active, then this chart will instead graph planetary latitudes, instead of zodiac position longitudes. In this alternate display, planets are normally clustered near the 0 degree mark. The -YX7 switch setting sets the radius in tenths of degrees to include, e.g. “-YX7 100” shows +/- 10 degrees on either side of 0 degrees latitude, “-YX7 50” shows +/- 5 degrees, and so on.
-r0 -X: True relationship wheel charts can be displayed in a window, i.e. where the planets of both charts are displayed in separate rings of the same wheel. Use the -r0 option to display this comparison type. For example, for the command “astrolog -r0 person1 person2 -X”, the following is displayed: The signs and houses as in person1’s chart are drawn in the outermost part of the wheel. Inside this is a ring of person2’s planets as displayed in person1’s houses, and inside of this are person1’s own planets. Finally at the very middle is an aspect grid, which shows those aspects that are occurring between the objects in the two charts. Basically this is just the standard wheel chart for person1, except that person2’s planets are in an outer ring of objects and the aspect grid shows the aspects of the relationship. Putting such a chart in animation mode only affects person2’s planets, so this is a great way to analyze transits: Doing “astrolog -t yourchartfile -X” will show all your current transits, and allow you to easily animate the transiting planets through your natal signs and houses.
-rb -X: Graphical biorhythm charts are available by combining the -rb (or -yb) switch with -X. This will make a graph of one’s biorhythm for the two weeks before and after the specified time, with days on the horizontal axis and the Physical, Emotional, and Intellectual percentages on the vertical. When any graphics chart is up, one may press the 'Y' key to revert to a biorhythm chart. (Note that as this is a relationship comparison chart, if you go to it from a graphics mode only showing one chart, it will show the biorhythm for them at their birth, and you will want to then animate or adjust it to get a useful display.)
--
A couple of conveniences for the graphics features exist. Note that the -Xo <graphicsfilename> option is only used in conjunction with the -Xb write output to bitmap switch (or the -Xp or -XM PostScript and metafile chart formats). Therefore, -Xo automatically assumes -Xb is set. (Invoking -Xb itself without -Xo will have the program prompt the user for the bitmap filename.) In other words, astrolog -Xb -Xo 'file' is the same as just astrolog -Xo 'file'. Astrolog includes its own appropriate X bitmap (a rainbow over an opened Third Eye) if one iconifies its X window.
For X windows, one can animate a graphics chart on the root background by combining -XB with the -Xn switch. This will be just like the animations done in windows except the root is being used instead. Astrolog can be run in the background this way to continually update your root to the current chart representing the present moment. Limitations with this are that since there’s no window, no keypresses can be processed so the program must be manually terminated, and that the continual updates will be as CPU intensive as the window animations are.
Text in graphics charts is done using Astrolog’s own internal font. This font includes glyphs for the high-Ansi 128-255 character range. These glyphs cover the common Windows-1252 codepage, which is a superset of ISO 8859-1 (Latin 1) but with extra characters defined for the 128-159 range.
Users of other versions of the program should find moving to the Microsoft Windows version of Astrolog easy and familiar. All the text and graphics chart displays are available and look the same. All chart info and command files work and haven't changed format any. All the command line switches are available and work and can even be passed to the program while running to do things if you prefer, in addition to the more user-friendly interface being available. All the keypress commands one can press while an interactive graphics screen was up are set as shortcuts for equivalent operations here. Basically, additional features and a more user friendly interface are presented, while all the other things are still available. :)
Not counting the About box and the standard Windows open file, save file, and printing items, Astrolog contains 16 dialogs, a couple of which are also shared by more than one command. There are nine top level menus not counting the system menu, which have among them 122 different options, or 261 counting all second level submenus! In using the dialogs, one should specify or enter the appropriate settings, and then press “OK” for them to take effect, or “Cancel” to discard any changes made. On pressing “OK”, the program will check all the fields for validity, and display an appropriate error message and not close the dialog if anything is out of range, giving a chance to correct or cancel. For numeric controls, note that if the existing value is displayed with a decimal point in it, floating point numbers are legal, while if there isn't one then integers are required.
Every menu command has an accelerator, i.e. an underscore below a letter, where when the menu is displayed one may press that letter to select that option (pressing Alt plus the appropriate letter may be used to pull down a top level menu). In addition every menu option has a unique direct keyboard shortcut, where pressing the appropriate key will invoke the command directly without having to pull down a menu. To the right of each menu option is listed the key or key combination that’s its shortcut. Note that a capital letter here means the shift key needs to be down, e.g. “Alt+o” means hold down the Alt key and press “o”, while “Alt+O” means hold down both the Alt and Shift keys and then press “O”.
Astrolog tries to be smart about what you’re trying to do when menu options are selected, and may automatically change settings to make the appropriate thing happen. For example, as with the DOS and X Windows versions, the charts in the Windows version can be divided into “text mode” i.e. just text, and “graphics mode” charts, where the first option on the View menu will switch between them. Charts like transit lists only exist in text form, so when selected you'll automatically leave graphics mode if in it; likewise, selecting most any item on the Graphics menu will enter it as those settings have no effect on text charts. Similarly, entering animation mode will automatically turn on the flicker free updates setting, and so on.
As with Astrolog versions on other platforms, you can use the mouse to draw on the window here too. Click and drag the left mouse button to scribble lines. Doing a Shift+click will draw a straight line from the location you last clicked to the current position. Doing a Control+click will draw a rectangle with opposite corners at the location last clicked and the current position. Doing Control+Shift+click will draw an ellipse with opposite corners at the two positions clicked. Finally, when the current display is either the world map or an astro-graph chart, one may do Alt+click or click the right mouse button on the map to relocate the chart to the spot on the world clicked upon, which will change the longitude and latitude of the current chart info in memory. For the right mouse button, you can click and drag to rotate various graphics charts: The chart sphere and globe displays can be rotated and well as tilted, while the world map and polar globe displays can be rotated back and forth along their single axis.
The window that the charts are drawn in has horizontal and vertical scrollbars on it. For charts that are just text, the scrollbars may be used to shift the chart up or left to view any characters that get written off the bottom or right edge of the window. For charts that are graphics, if the chart is larger than the window it’s in, the scrollbars may be used to move around the viewable portion of it, while if the chart is smaller than the window, the scrollbars will control where in the window the chart is drawn, e.g. centered, in upper left corner, etc. Note that it’s most common and logical to have the chart and window the same size, in which case moving the scrollbars has no effect on the graphics chart. Note that for text mode charts, there exists behavior such that if the window has been scrolled down so that all the text is off the top of the screen, the program will automatically scroll up and redraw again, so the bottom 20 rows or so are visible.
Like other versions, Astrolog for Windows will read in and process the contents of the astrolog.as command file if available on startup for default settings. Immediately after this the program will process the contents of the Windows command line if any, i.e. any command switches or parameters specified with either the program’s icon or given when running the program by typing in its path.
In Windows explorer, Astrolog’s icon is a yellow ringed planet. Astrolog setup claims ownership the file extension “.as”, standing for Astrolog Switch file. The “.as” extension files appear in Windows as a gray ringed planet icon. Double clicking a “.as” file (or right clicking it and selecting “Open”) will launch Astrolog and have it automatically open that file. Right clicking a “.as” file and selecting “Edit” will open the file in the text editor Notepad.
--
Astrolog for Windows is reasonably intuitive to use and do what you want with even without referring to any documentation. Still for completeness and detail, below is a quick rundown on all the menu options. Where applicable, the command switch corresponding to the menu command is given in brackets; one may look up the documentation for that command switch in earlier sections for additional information.
File menu commands:
Open Chart...: This brings up the standard Windows open file dialog, allowing one to select a chart info, chart position, or any other Astrolog command file. This file will be loaded and processed, with the new chart being displayed in the window. [This does the same as the -i <file> command switch. Note that this ignores the various Astrolog directory environment variables that -i can use.]
Open Chart #2...: This also brings up the Windows open dialog, allowing one to select a chart file, however any chart time and location settings will be put into the “second” chart slot, as used in relationship charts. [This does the same as the -r <file1> <file2> switch, just that it only sets the contents of <file2>.]
Save Chart Info...: This brings up the standard Windows save file dialog, allowing one to enter a filename, which will be created and the time and location of the current chart will be written to it. If a file is specified without the extension delimiter "." in the name, then the default extension “.as” will automatically appended. If for some reason one really does want to save a file without any extension, they should just append a “.” to the filename to give it a zero length extension. Note that, as with all of Astrolog’s Save dialogs, this will query for a confirmation before overwriting or replacing existing files. [This does the same as the -o <file> switch.]
Save Chart Positions...: This also brings up the Windows save dialog, however here to the created file will be written the actual positions of all the planets and house cusps, and no time or location info. [This does the same as the -o0 <file> switch.]
Save Chart Text Output...: This allows one to save the actual text displayed in a window for a text chart to a file as simple text. [This does the same as the -os <file> switch.]
Save Chart Bitmap...: This saves the current graphics display to a Windows bitmap file. [This does the same as the -Xb switch.]
Save Chart Picture...: This saves the current graphics display to a Windows metafile file. [This does the same as the -XM switch.]
Save Chart PostScript...: This saves the current graphics display to an encapsulated PostScript file. [This does the same as the -Xp switch.]
Save Chart Wireframe…: This saves a special 3D version of the current graphics display to a Daedalus 3D wireframe file. [This does the same as the -X3 switch.]
Save Settings...: This allows one to save settings made within the program so they will automatically be in effect again the next time the program is run. Without this, one can change settings such as the house system, aspect orbs, etc, but they will go away upon exiting the program. The way to make setting changes persistent is to edit the astrolog.as default settings file. This command has the program automatically generate a new astrolog.as file for you based on the current state of the program. The standard Windows Save dialog will be brought up as with all the other Save commands. The default filename to save to will of course be astrolog.as, to replace the existing settings file. You can select a different name to save the file to if you like, where the file will be a command switch file like any other except it won't be read in automatically on startup like astrolog.as. Note this feature won't save every possible program setting, such as the active chart being displayed, but it will save most things; see the astrolog.as file itself for what exactly is saved. One can start the program, immediately do File Save Settings, and create an astrolog.as file virtually identical to the one that was just read in.
Save As Wallpaper: This submenu allows one to easily set an Astrolog graphics chart to be the background bitmap for the Windows desktop. This functionality can be done without this command, in which one can do File Save Bitmap to create a bitmap file, then go into the Windows control panel desktop settings, and point the wallpaper bitmap to the file created. However this command allows it do be done with a click of the mouse, during which a bitmap file called “Astrolog.bmp” will automatically be created and saved in your Windows directory. The five commands under this submenu are:
Tile Bitmap: This command centers the Astrolog chart in the middle of the screen.
Center Bitmap: This command tiles the chart across and down it.
Stretch Bitmap: This command stretches or shrinks both chart dimensions separately to cover the background dimensions.
Fit Bitmap: This command will stretch or shrink the bitmap to just fit within the desktop while preserving proportion, so will leave space on the horizontal or vertical edges if the proportions are different from the background.
Fill Bitmap: This command will stretch or shrink the bitmap to completely fill the desktop area while preserving proportion, so will crop content on the horizontal or vertical edges of the bitmap if its proportions are different from the background. Note the “Fit” and “Fill” commands will only work on Windows 7 or later, which supports these styles of background.
Print...: This feature allows one to directly print charts from within the program. This command brings up the standard Windows Print dialog, with the same look and feel and options available as when printing from other Windows programs such as Write. The image printed will be the exact chart that appears in the window. For graphics charts, the printout will be a one page image of the display, scaled to be as large as possible within the bounds of the page. The window’s horizontal and vertical scrollbars determine where in the page the image is situated, e.g. if the vertical scrollbar is all the way to the top, the image will be at the top of the page, if centered, then it will be vertically centered, and so on. Note that the colors in the window will be the colors on the paper, where you probably want to have the Graphics Reverse Background setting active, so the chart will be black on a white background and hence not waste ink. For monochrome printers you also probably want to have the Graphics Monochrome setting active, to prevent colors like yellow coming out as a hard to see light gray. For text mode charts, the printout will be on a white background regardless of what’s in the window. You may want to turn off the View Colored Text setting if you don't have a color printer. The font size may be affected by the Graphics Character Scale command settings. For the standard medium character scale on a 8.5"x11” paper, there will be 70 rows to a page. The text printout will be more than one page if there are more than 70 rows of output. Note that even with this feature available, one may still want to use the program’s clipboard and file features to print from another program. Astrolog’s Print command makes decisions about layout, font, etc, for you; some may find this convenient, but others may still prefer to import Astrolog output into a word processing or desktop publishing program to have full control. The graphics generated by printing a chart directly, and printing a chart bitmap, metafile, or PostScript file, have slightly different textures so one may prefer one format to another. Still, direct printing is available to those of us who would like to use it.
Print Setup...: This brings up the standard Windows Print Setup dialog, allowing one to select settings such as the printer to print to, and whether the printed page will be oriented in portrait or landscape mode. This dialog is also accessible from the Print dialog itself via the “Setup...” button, but is also made available separately here.
Exit: This terminates the program. Note that pressing Control+C or “q” will also quit in addition to this and the command’s “Escape” shortcut key.
Edit menu commands:
Enter Command Line...: This brings up a dialog with one edit control, in which one may enter a command line. This gives access to obscure program features that don't have their own menu options yet, as well as easy access to the command switches for those of us who like them.
Run Macro (Normal Set): This, along with the next three menu items of “Run Macro (Shift Set)”, “Run Macro (Control Set)”, and “Run Macro (Alt Set)”, are submenus each of which contain 12 entries of the form “Macro <1-48>“. These run the appropriate command switch macro. See the -M0 switch for information on how to define a macro. [This does the same as the -M switch.]
Note that pressing F1 will show documentation and do the same as the “Help / Documentation / Open Helpfile” command. That’s assuming macro #1 hasn’t been defined (if macro #1 has been defined, F1 will still invoke that macro). Similarly, pressing Alt+F4 will follow the Windows standard and close the program (instead of first displaying an error about macro #40 not being defined, and then closing). If macro #40 has been defined, Alt+F4 will still only invoke that macro.
Copy Chart Text Output: This is like the File Save Chart Text Output command except the text will be copied to the Windows clipboard. After doing this one can run or switch to an application such as Notepad, Write, or Word, and use their Edit Paste command to paste in the chart text, which may then be printed, combined with other text, and so on. Next to the Print command, this is the easiest way to print Astrolog charts.
Copy Chart Bitmap: This is like the File Save Chart Bitmap command except the Windows bitmap will be copied to the clipboard, which may again be pasted into another application.
Copy Chart Picture: This is like the File Save Chart Picture command except the Windows metafile will be copied to the clipboard. Note that when printing to laser printers, the Picture format is recommended over the Bitmap format because its output is free of any pixel blockiness.
Copy Chart PostScript: This is like the File Save Chart PostScript command except the PostScript file will be copied to the clipboard as simple text.
Copy Chart Wireframe: This is like the File Save Chart Wireframe command except the 3D wireframe file will be copied to the clipboard as simple text.
View menu commands:
Show Graphics: This toggles the current chart display between text and graphics mode. Text charts are drawn in the window as simple text such as might appear in a DOS box, while graphics charts are pretty high resolution wheels and the like. [This does the same as the -X switch.]
Buffer Redraws: This option on the Window Settings submenu toggles whether or not screen updates are smooth. When off, the screen clears and the chart redraws as you watch, while when on, the program “pauses” while the update is done behind the scenes after which the new chart is displayed all at once. Animation mode automatically turns this setting on to provide flicker free updates.
Redraw Screen: This option on the Window Settings submenu simply redraws the current screen. Most often this is used to erase any scribbles one may have added with the mouse buttons.
Clear Screen: This option on the Window Settings submenu simply erases the screen leaving a blank window, where the next redraw will bring the chart back. This can be used if one wants to draw on an empty screen.
Hourglass On Redraw: This option on the Window Settings submenu toggles whether or not the program puts up the hourglass wait cursor while redrawing a chart. I've found it most natural to have this on normally to know when the program is busy calculating, but off during animations.
Chart Resizes Window: This option on the Window Settings submenu toggles whether the window will resize when the chart size increases or decreases. For example, if displaying a graphic aspect grid which is a square chart, and one switches to the rectangular shaped astro-graph map chart, this setting when on, will resize the window to be the new rectangular shape. When off, the chart will either not fill up the whole window or will overlap its edges, in which case the scrollbars may be used to view all parts of the graphic. Note that when the window size changes in this way, the program will automatically move the window’s location appropriately if the new size would make the window appear partially off the screen edge.
Window Resizes Chart: This option on the Window Settings submenu toggles whether the chart will resize whenever the window size is increased or decreased. For example, when displaying the graphic wheel chart, and one manually resizes the window to be larger, this setting when on, will make the wheel bigger too so its fills the new window. [Note that the X Windows version of Astrolog always behaves as though this and the above setting are both on.]
Size Chart To Window: This option on the Window Settings submenu does a one time resize of the chart to fill the dimensions of the current window. This is only relevant for graphics charts that don't already have a forced fixed size, and for when the Window Resizes Chart setting is off.
Size Window To Chart: This option on the Window Settings submenu does a one time resize of the window to be the dimensions of the current chart. This is only relevant for graphics charts and for when the Chart Resizes Window setting is off.
Scroll Page Up, Scroll Page Down, Scroll to Beginning, Scroll to End: These four commands on the Window Settings submenu allow one to respectively: scroll the window up as if one clicked above the thumbnail on the vertical scrollbar, scroll the window down as if one clicked below the thumbnail on the vertical scrollbar, do the same thing as if one scrolls to the far upper left, and do the same thing as if one scrolls to the far bottom right. Note that one will generally want to use the keyboard shortcuts for these commands (the Page Up, Page Down, Home, and End keys) rather then select them from the menu, but they’re on the menu too just for convenience.
Colored Text: This toggles whether or not the characters in text charts are multi-colored. Colored text is recommended to have on normally because it looks nice, but should be turned off when saving text output to file or copying text to the clipboard to remove the control characters which cause the color changes. [This does the same as the -k switch.]
Set Colors...: This brings up the Set Colors dialog. One may use the various combo controls to change the colors used in graphics and text charts, by selecting a color from a dropdown, or by entering its name or abbreviation or index from 0-15. The Standard Color Palette covers generic uses of color. [The sixteen settings here do the same as the sixteen settings covered by the -Yk0 and -Yk switches.] The Elements group covers the colors used for the four elements. [This does the same as the -YkC switch.] The Seven Rays group covers the colors of the esoteric Rays. [This does the same as the -Yk7 switch.]
Show Interpretations: This toggles whether or not interpretations are given for text charts. [This does the same as the -I switch.]
Print Nearest Second: This toggles whether or not all zodiac positions are displayed to the nearest arc second as opposed to just the arc minute. [This does the same as the “0” part of the -b0 switch.]
Applying Aspects: This toggles whether or not aspect orbs are displayed in the form of about to happen or just happened, as opposed to degrees narrow or degrees wide. [This does the same as the “a” part of the -ga and -aa switches.]
Parallel Aspects: This toggles whether or not aspects in the “vertical plane” are used, with the parallel and contraparallel aspects shown as opposed to conjunction and opposition. [This does the same as the “p” part of the -gp and -ap switches.]
Info menu commands:
Set Chart Info...: This brings up the generic Enter Chart Info dialog, which is the place for one to actually create a chart by specifying the time and location in question. The dialog contains eight main controls, for month, day, year, time, Daylight saving time flag, time zone, longitude, and latitude. These have dropdowns from which one may optionally choose common values. If the Print Nearest Second command is set, then times and locations in this dialog will be displayed to the second, instead of just to the minute. After this are two optional text edit controls where one may enter the name and location for the chart. The special button “Now” will copy the current time over all the fields. The special button “Previous” will copy the contents of the last chart cast over the fields. [The eight main combo controls cover the same fields as the -qb switch. The two text controls cover the same fields as the -zi switch. The “Now” button does the same as the -n switch. The “Previous” button does the same as using the “-i set” virtual file.]
Chart For Now: This sets the current chart information to the current time now. [This does the same as the -n switch.]
Default Chart Info...: This brings up the Default Chart Info dialog, in which one may specify the default Daylight setting, time zone, the correction factor to add to “now” charts, longitude, latitude, elevation above sea level, and name and location strings. These settings are used in commands such as “Chart For Now”, in which the current time obtained needs to be combined with some location to make a complete chart. [The eight controls in this dialog correspond respectively to the -z0, -z, -Yz, the two parameters passed to the -zl, the -zv, and the two parameters passed to the -zj switches.]
Set Chart #2 Info...: This brings up a dialog identical to the standard Chart Info dialog, except here the chart settings specified are put into the “second” chart slot, as used in relationship charts. This command is to “Set Chart Info”, as the “Open Chart #2” command is to “Open Chart”. [This does the same as the -i2 switch.]
Charts #3 And #4...: This brings up a dialog giving one access to all four chart slots, with buttons which will bring up the file open dialogs to load chart info into each slot, and buttons allowing access to the chart info dialogs to view or change the info in each slot. This dialog also has a radio button group to indicate what type of wheel and how many chart rings to display: a single wheel, bi-wheel, tri-wheel, or quad-wheel. [This covers the same as the -r3 and -r4 switches, and the -i3 and -i4 switches.]
No Relationship Chart: This and the remaining eight commands on the Info menu specify the current relationship chart mode if any, where the currently active mode has a check mark by it. This first command turns any relationship mode off, where just a single chart is shown, with any “second” chart ignored. [This does the same as the -r switch when invoked as _r.]
Comparison Chart: This sets the relationship chart mode to dual comparison, where two charts are shown side by side, e.g. the wheel chart becomes a bi-wheel, and aspect grids are between two sets of planets. [This does the same as the -r0 switch, except it uses the two charts already in memory as opposed to reading them from file.]
Synastry Chart: This does a synastry chart, a single chart consisting of the second chart’s planets in the first chart’s houses. [This does the same as the -r switch.]
Composite Chart: This does a composite chart, a single chart consisting of all the midpoints between each object pair in the two charts. [This does the same as the -rc switch.]
Time / Space Midpoint Chart: This does a midpoint relationship chart, a single chart cast at the time and location half way between those of the two charts. In other words, this replaces chart #1 with the midpoint of chart #1 and #2, and then immediately exits relationship chart mode so the midpoint chart can be worked with normally. [This does the same as the -rm switch.]
Date Difference Chart: This displays the span of time between the two charts, given in all units from the nearest second to the nearest year. [This does the same as the -rd switch.]
Biorhythm Chart: This displays a biorhythm chart, for a person born at the time in the earlier of the two charts, for the time in the other chart. [This does the same as the -rb switch.]
Transit And Natal: This sets a mode identical to “Comparison Chart” above except that the transit restrictions will apply to the second chart and the natal restrictions to the first, instead of the natal restriction set to both. [This does the same as the -rt switch.]
Progressed And Natal: This sets a mode like “Transit And Natal” above, except that the second chart actually shown (outer ring in wheel charts) will be a chart made by progressing the first chart to the time in the second. [This does the same as the -rp switch.]
Setting menu commands:
Sidereal Zodiac: This toggles whether or not the chart is cast with respect to the sidereal zodiac as opposed to the tropical. [This does the same as the -s switch.]
Heliocentric: This toggles whether or not the chart is cast with respect to the Sun for a heliocentric chart, as opposed to the Earth in a standard geocentric chart. [This does the same as the -h switch toggling between Sun and Earth centered charts.]
House System: This submenu allows one to select among 21 systems of house division to use. [This does the same as the -c switch.]
House Settings: This submenu allows one to toggle various settings related to houses. The eight commands here are:
Solar Chart: This option toggles whether or not the houses are rotated to put the Sun on the Ascendant for a solar chart. Note that a check mark will be by this command when the houses are rotated any amount, even if the focus object isn’t the Sun and the position being rotated to isn’t the Ascendant. [This does the same as the -1 switch.]
3D Houses: This option toggles whether house placements are determined by 3D zodiac position and latitude coordinates, instead of just a simple placement of zodiac position between house cusps. [This does the same as the -c3 switch.]
Show Decans: This option toggles whether or not the planet positions are adjusted to put each object in the sign corresponding to its decan. [This does the same as the -3 switch.]
Show Dwads: This option toggles whether or not the planet positions are adjusted to put each object in the sign corresponding to its dwad. [This does the same as the -4 switch.]
Flip Signs & Houses: This option toggles whether or not planet and house positions are swapped with respect to each other for a Domal chart. [This does the same as the -f switch.]
Geodetic Houses: This option toggles whether or not house cusps are only computed based on the chart’s longitude for geodetic houses. [This does the same as the -G switch.]
Vedic Wheel Display: This option toggles whether wheel charts are displayed in Vedic format or not. [This does the same as the -J switch.]
Show Navamsas: This option toggles whether or not the planet positions are adjusted to generate a navamsa chart. [This does the same as the -9 switch.]
Aspect Settings...: This brings up the Aspect Settings dialog, allowing one to set various things related to each aspect. For each of the 18 aspects, there is: (1) A checkbox for whether the aspect is to be included in charts at all, (2) an edit control specifying the aspect’s maximum orb, (3) an edit control specifying the aspect’s actual angle, (4) an edit control specifying the aspect’s relative power for influence charts, and (5) an control specifying the color to use when displaying the aspect. In addition there are three buttons: (1) “Restrict All” which automatically checks all aspects, (2) “Unrestrict All” which unchecks them all, and (3) “Toggle Majors” which inverts the status of the first five aspects. [The checkboxes do the same as the -A and -RA switches. The orb fields do the same as the -Ao or -YAo switches. The angle fields do the same as the -Aa switch. The influence fields do the same as the -YjA switch. The color fields do the same as the -YkA switch.]
Object Settings...: This brings up the Object Settings dialog, allowing one to set various things related to each planet. For each of the first 20 objects, there is: (1) an edit control specifying the maximum aspect orb allowed to that object, e.g. no more than a two degree orb to the North Node, (2) an edit control specifying an aspect orb addition allowed, e.g. widen all orbs by one degree for the Sun, (3) an edit control specifying the object’s relative power for influence charts, and (4) an edit control specifying the color to use when displaying the object, which also allows selecting “Element” or “Ray” to become the colors of the element of the sign that the planet rules, or the Ray associated with the sign. [The max orb fields do the same as the -Am or -YAm switches. The orb addition fields do the same as the -Ad or -YAd switches. The influence fields do the same as the -Yj switch. The color fields do the same as the -YkO switch.]
More Object Settings...: This brings up a dialog much like the Object Settings dialog above, except this dialog is for the house cusp and Uranian objects. Like the standard Object Settings dialog which is for the first 20 objects, this dialog allows one to set the maximum aspect orb allowed to, the orb addition factor for aspects concerning, and the power influence value of, each cusp and Uranian object. This dialog also has an object labelled “All Stars”, which applies to all fixed stars equally.
Restrictions...: This brings up the Object Restrictions dialog, allowing one to specify whether each planet or other object is included in charts, where each object has a checkbox, with checked meaning restricted. In addition there are several buttons added for convenience: (1) “Restrict All” which automatically checks all objects, (2) “Unrestrict All” which unchecks them all, (3) “Toggle Minors” which inverts the state of the asteroids and all the other objects in the second set of ten, (4) “Toggle Cusps” which inverts the state of the 12 cusp objects, (5) “Toggle Uran.” which inverts the eight Uranian planets, and (6) “Copy From Other Restriction Set” which sets all items to be the state of those in the parallel transit restriction set. [This dialog does the same as passing values to the -R switch. The “Restrict All”, “Unrestrict All”, “Toggle Cusps”, and “Toggle Uran.” buttons do the same as the -R0, -R1, -RC and -Ru switches respectively.]
Include Minors: This toggles whether or not the asteroids and other minor objects are included in charts. [This does the same as the -R switch when invoked without any parameters.]
Include Cusps: This toggles whether or not house cusps are included as objects in charts such as aspect grids and transit searches. [This does the same as the -C switch.]
Include Uranians: This toggles whether or not the Transneptunian planets are included in charts. [This does the same as the -u switch.]
Include Fixed Stars: This toggles whether or not stars are included in charts. [This does the same as the -U switch.]
Star Restrictions...: This brings up the Star Restrictions dialog, which is similar to the standard Restrictions dialog except it deals with the fixed star or other deep space objects. Each of the 47 fixed stars has a checkbox, where in addition there are two buttons: (1) “Restrict All” which automatically checks all the star objects, and (2) “Unrestrict All” which unchecks them all. [The “Restrict All” and “Unrestrict All” buttons do the same as the -RU0 and -RU1 switches.]
Transit Restrictions...: This brings up the Transit Restrictions dialog, which is identical the standard Restrictions dialog in every way except it sets the status of the objects in the transit restrictions array, as used in transit charts. The “Copy From Other Restriction Set” button here copies all flags from the standard restriction set. [The various operations here do the same as the -RT switch and derivatives.]
Calculation Settings...: This brings up the Calculation Settings dialog, used to set various settings which affect zodiac positions of objects. They are:
(1) A dropdown for the calculation method, which (depending on
what’s been compiled into the program) will allow one to calculate planet
positions by up to five different methods: Swiss Ephemeris, slightly less
accurate Moshier ephemeris, old and less accurate Placalc ephemeris, very old
and much less accurate Matrix formulas, or None [same as -b, -bs, -bp, and -bm
switches]. The “Swiss Ephemeris” selection will show which version of Swiss
Ephemeris is being used. When “None” is selected most objects will be placed at
0Aries, which of course isn’t useful except for obscure testing scenarios.
(2) An edit control to specify the zodiac degree offset or ayanamsa [same as
the parameter passed to the -s switch]. This control has a dropdown to allow
quick selection of several common systems of sidereal astrology. The values in
it are 0.0 for Fagan-Bradley, 0.883333 (or 0 degrees 53' and 0”) for Nirmala
Chandra Lahiri [Robert Hand version], 0.98 (or 0 degrees 58' and 48”) for
Krishnamurti, 2.329444 (or 2 degrees 19' and 46”) for B.V. Raman, and -3.619166
(or -3 degrees 37’ and 9”) for Djwhal Khul.
(3) The central planet, e.g. geocentric, heliocentric, or some other planet
[same as the parameter passed to the -h switch].
(4) The harmonic chart factor [same as -x switch].
(5) A checkbox indicating whether the North and South Node objects are the True
Node or the Mean Node [same as -Yn switch].
(6) A checkbox indicating whether the four angular cusp objects are set to the
positions of the actual house as defined by the current house system [same as
-Yc switch].
(7) A radio button group specifying the solar chart setting, i.e. whether to
rotate the house cusps so an object is on the Ascendant or on the Midheaven,
and an edit control specifying which object to use when active [all this does
the same as the -1 and -2 switches].
(8) A checkbox in the solar chart group above indicating whether the Ascendant
or Midheaven should be rotated to the start of the object’s sign [same as -10
and -20 switches].
(9) A checkbox indicating whether to display all planetary positions relative
to Earth’s equator, as opposed to the ecliptic as is standard in astrology
[same as -sr switch].
(10) A checkbox indicating whether true instead of apparent positions are shown
[same as the -YT switch].
(11) A checkbox indicating whether topocentric positions relative to one’s
position on the surface of the Earth are shown [same as -YV switch].
(12) A checkbox indicating whether 3D houses are active, in which house
position determination takes into account planetary latitude [same as -c3
switch].
(13) A checkbox indicating whether 3D aspects are active, in which aspect angle
determination takes into account planetary latitude [same as -A3 switch].
(14) A checkbox indicating whether 3D orbs are active, in which aspect orbs are
applied to planetary latitude as well as longitude [same as -Ap switch].
Display Settings...: This brings up the Display Settings dialog, used to set various settings that affect cosmetic changes in chart displays. They are:
(1) A checkbox indicating whether to round positions to the nearest
unit instead of crop [same as -Yr switch].
(2) A checkbox indicating the date display format [same as -Yd switch].
(3) A checkbox indicating the time display format [same as -Yt switch].
(4) A checkbox indicating the distance display format [same as -Yv switch].
(5) A checkbox indicating whether minor or equivalent aspects to house cusp
objects are dropped [same as -YC switch].
(6) A checkbox indicating whether to leave off the rightmost characters of text
chart rows if they exceed the text columns setting [same as -Y8 switch].
(7) Two checkboxes indicating whether to include sign and direction changes in
transit to transit searches [same as -YR0 switch].
(8) An edit control indicating the “reverse restriction”, or a required object
that must be present in charts involving aspects between planets [same as -RO
switch].
(9) A checkbox indicating whether to export text files in HTML format [same as
-kh switch].
(10) A checkbox indicating whether to export text and print in an intuitive manner
[same as -YO switch].
(11) A checkbox indicating whether to output chart info files in the old
non-command switch format used before version 4.20 [same as -Yo switch].
(12) A checkbox indicating whether metafile and PostScript graphics files
should use system as opposed to simulated fonts for glyphs and other characters
[same as -YXf switch].
(13) Two edit controls specifying the horizontal and vertical paper size in
inches to use in PostScript charts [same as -YXp0 switch]. Sizes may be
specified in inches or centimeters. If the parameter ends in “cm” then it will
be parsed as centimeters, and if it ends in “in” then it will be parsed as
inches. If there’s no units, then it will be parsed based on the distance
display format setting above.
(14) A radio button group indicating how to orient the paper for PostScript
charts [same as -YXp switch].
(15) A radio button group specifying how to display zodiac positions, i.e. in
the standard degree/sign/minute notation, in hours/minutes, or just degrees
[these items correspond to the -sz, -sh, and -sd switches].
(16) Five checkboxes to control whether standard rulerships, esoteric
rulerships, Hierarchical rulerships, exaltations, and Ray rulerships should
appear in charts [same as -YR7 switch].
(17) Four checkboxes to control whether the events of rising, zenith transit,
setting, and nadir transit appear in the rising and setting chart [same as -YRZ
switch].
(18) The number of aspects to include in charts [same as the -A switch].
(19) The number of text columns to use in interpretation paragraphs [same as
the parameter passed to the -I switch].
Chart menu commands:
Standard List: This sets the current chart displayed to be the standard default chart, i.e. a standard list of positions in text mode and a wheel (or bi-wheel in comparison relationship mode) chart in graphics mode. [This does the same as the -v switch.]
House Wheel: This sets the current chart displayed to be a house emphasized wheel chart, i.e. a simple text wheel chart divided by houses in text mode, and a wheel chart where all the houses are made to be the same size in graphics mode. [This does the same as the -w switch.]
Aspect Midpoint Grid: This sets the current chart displayed to be a grid showing all aspects and all midpoints between each pair of planets. It will show either aspects or midpoints in comparison relationship mode. [This does the same as the -g switch.]
Aspect List: This sets the current display to be a list of all aspects sorted by influence, and is a text mode only chart. [This does the same as the -a switch.]
Midpoint List: This sets the current display to be a list of all midpoints sorted by zodiac position, and is a text mode only chart. [This does the same as the -m switch.]
Local Horizon: This sets the current display to show all the planets and other objects as they appear relative to the local horizon or sky, i.e. a list of altitude and azimuth values in text mode, and a visual coordinate plot in graphics mode. [This does the same as the -Z switch.]
Solar System Orbit: This sets the current display to show the orbital positions of all the planets, i.e. a list of the x, y, and z coordinates of each object relative to the sun (or current central body) in text mode, and an aerial view of all the planets in their orbits in graphics mode. 0Ari is at the left of the screen, and 0Can is at the bottom. [This does the same as the -S switch.]
Gauquelin Sectors: This sets the current display to show all the planets as situated in the 36 Gauquelin sectors, along with their plus zone status, i.e. a list of objects and locations in text mode, and a sector wheel in graphics mode. [This does the same as the -l switch.]
Calendar: This sets the current display to be a simple calendar of the month or year surrounding the time of the chart in question. [This does the same as the -K switch.]
Influence: In text mode, this sets the current display to be a list of the influence or power of each planet with respect to its positioning and aspects. In graphics mode, this shows dispositor graphs of the main planets for their sign and house placements. [This does the same as the -j switch.]
Esoteric: This sets the current display to be an esoteric astrology chart. In text mode this lists the planets and the Rays and rulers associated with each planet’s position, and also lists the Rays and their influence in the chart. In graphics mode this shows what amounts to a Ray ephemeris, plotting Ray influence vs. time for each of the seven Rays. [This does the same as the -7 switch.]
Astro-Graph: This sets the current display to be an astro-graph chart, showing where on the world each planet was rising, on the Midheaven, etc. In text mode this lists the latitude and longitude of each line at various intervals, and in graphics mode actually draws and labels each line on a map of the world. [This does the same as the -L switch.]
Ephemeris: This sets the current display to be an ephemeris chart, i.e. a list of the zodiac positions of each planet over a range of days (e.g. the month or year) surrounding the time of the chart in question for text mode, and a plot of position vs. time for each object in graphics mode. [This does the same as the -E switch.]
Arabic Parts: This sets the current display to be a list of the positions of all Arabian part items for the given time, and is a text mode only chart. [This does the same as the -P switch.]
Rising And Setting: This sets the current display to be a list of the times during the day any planet rises, sets, and crosses the meridian and nadir, and is a text mode only chart. [This does the same as the -Zd switch.]
Transits...: This brings up the Transits dialog, used to create various transit lists. The first thing to do when using this dialog is to set the type of chart desired in the “transit type” radio button group. The five choices here are:
(1) “Transit to transit times”, which will display exact times of
aspects and other events such as sign and direction changes over a range of
time [same as -d switch].
(2) “Transit to transit influence”, which will display all aspects between
objects in the current chart ordered by significance [same as -D switch].
(3) “Transit to transit graph”, which will for each aspect show a graph of its
orb strength over a range of time [same as -B switch].
(4) “Transit to natal times”, which will display exact times of aspects made to
natal planets from transiting planets over a range of time [same as -t switch].
(5) “Transit to natal influence”, which will display all aspects between
transiting and natal objects for a given time ordered by significance [same as
-T switch].
(6) “Transit to natal graph”, which will for each transit to natal aspect show
a graph of its orb strength over a range of time [same as -V switch].
(7) “None”, which gets out of any transit chart mode.
The second thing to do is to be aware of the “progress instead of transit” checkbox; when checked, all the transit charts will instead be progressed charts, i.e. the transit types will be:
(1) Progressed to progressed times [same as -dp switch].
(2) Progressed to progressed influence [same as -D combined with -p].
(3) Progressed to progressed graph [same as -Bp switch].
(4) Progressed to natal times [same as -tp switch].
(5) Progressed to natal influence [same as -Tp switch].
(6) Progressed to natal graph [same as -Vp switch].
Now, for the “transit to natal” charts, you should set the values in the “transit to natal info” combo control group (these controls are ignored for the transit to transit charts). There are controls for “month”, “day”, “year”, and “time” like those in the Chart Info dialog, which here set the time for the transiting chart (the natal chart settings should of course be set in Chart Info). Pressing the “Now” button in the dialog will set these time values to be that of the current moment. In addition, for the “transit to transit/natal times” and “transit to transit/natal graph” charts, you should select from the “times and graph cover” radio button group appropriately (these controls are ignored for the transit influence charts). In this group one may choose to scan over a single day, a month, year, or range of years for aspects, where the time in question is that surrounding the natal chart set in the Chart Info dialog for “transit to transit times/graph”, and is the time surrounding that in the “do transits for” group in this dialog for “transit to natal times/graph”. You should note here that (1) when the “range of years” radio button is selected, the number of years to scan over may entered in the “years to span” edit control (with this setting being ignored otherwise), (2) the shortest period “transit to natal times” may be done for is a single month, meaning that even if you select the “given day” radio button in combination with this chart you'll get the “given month”, and (3) that some of the time settings in the “do transits for” group are effectively ignored when doing “transit to natal times” over a large range, e.g. when doing the “given year”, the values in the “month”, “day”, and “time” controls don't affect the chart any.
Another checkbox named “display transit returns only”, will when checked affect the “transit to natal search” chart so that it only shows returns, and affect the “transit to natal influence” chart so that it only shows aspects between a transiting planet and the same natal planet [same as the -tr, -Tr, and -Vr switches]. Another checkbox named “graphs include all planets” affects affects the transit to natal graph and transit to transit graph charts, and causes them to not autorestrict certain fast moving planets [same as the -B0 and -V0 subswitches]. Also for the two “times” charts, you can change the value in the “searching divisions” edit control, which determines at how narrow intervals to cast charts for, with higher values giving more accurate times but taking longer to compute [this is the same as the optional parameter passed to the -d switch].
Progressions...: This brings up the Progressions dialog, which as its name suggests allows one to do various forms of progressed charts. The first thing to do when using this dialog is to set the “do progression” checkbox appropriately [same as -p switch]. When checked, all standard charts Astrolog calculates will be progressed; when clear, all charts will be normal meaning the rest of the settings in the dialog are ignored. Assuming this is checked, you then want to set the values in the “progress chart to” combo control group. There are controls for “month”, “day”, “year”, and “time” like those in the Chart Info dialog, which here set the time to progress the natal chart to (the natal chart being of course set in Chart Info). Pressing the “Now” button in the dialog will set these time values to be that of the current moment. Next, you may set the values in the “progression settings” control group to define the type of progression to do. There is a radio button pair which one may use to select between “secondary progression” or a “solar arc progression” [same as -p0 switch]. Also there is a “degrees per day” combo control which one may use to set the progression speed [same as -pd switch]. A number may be typed in, or one of several common values for this setting may be selected from the dropdown: The number 365.24219 here gives the standard “year for a day” rate, while other values will do tertiary progressions.
Chart Settings...: The brings up the Chart Setting Details dialog, which defines various minor settings that go with and affect the various displays. They are:
(1) A checkbox indicating whether to display planet velocity values
relative to average speed in the text mode standard chart list [same as -v0
switch].
(2) An edit control specifying the number of text rows to have in each house
for the text mode wheel chart [same as the parameter passed to the -w switch].
(3) A checkbox indicating whether the text house wheel chart lists objects in
Western houses four through nine in reverse order [same as -w0 switch].
(4) A checkbox indicating whether the text aspect grid lists all aspect configurations
(e.g. Grand Trines) after the grid [same as -g0 switch].
(5) A checkbox indicating whether the relationship aspect grid shows midpoints
instead of aspects [same as -gm switch].
(5) A checkbox indicating whether the text aspect list also gives a summary of
the number of aspects of each type and to each planet [same as -a0 switch].
(6) A checkbox indicating whether the text midpoint list also gives a summary
of the number of midpoints in each zodiac sign [same as -m0 switch].
(7) A checkbox indicating whether the text midpoint list also for each midpoint
gives a sublist of each aspect from a planet to it [same as -ma switch].
(8) A checkbox indicating whether the local horizon chart is displayed with
respect to the poles, where in text mode the positions are given in prime
vertical coordinates, and in graphics mode centers the display around a view
looking straight up as opposed to at the horizon [same as -Z0 switch].
(9) A checkbox indicating whether the Gauquelin sector chart is computed as a
fast approximation based on Placidus cusps [same as -l0 switch].
(10) A checkbox indicating whether the text influence chart also lists the
influence of each sign in the chart after the influences of all the planets
[same as -j0 switch].
(11) An edit control specifying the degree interval at which longitude and
latitude coordinates are given for the curved Ascendant and Descendant lines in
the text astro-graph chart [same as the parameter passed to the -L switch].
(12) A checkbox indicating whether the text astro-graph chart also lists all
latitude crossings between lines [same as -L0 switch].
(13) A checkbox indicating whether the text calendar chart is for the entire
year as opposed to just the month surrounding the time in the current chart.
(14) An edit control specifying the number of Arabian parts to include in the
Arabic part chart [same as the parameter passed to the -P switch].
(15) A checkbox indicating whether to display the formulas for the parts in the
Arabic part chart in A+C-B as opposed to A-B+C form [same as -P0 switch].
(16) A radio button group which determines in what order to sort the fixed star
objects for charts such as the standard text listing [same as the letter if any
included with the -U switch].
(17) A radio button group which determines in what order to sort the parts in
the Arabic part chart [same as the letter if any included with the -P switch].
(18) An edit control specifying the number of days covered by biorhythm charts [same
as -Yb command switch].
Graphics menu commands:
Show Chart Sphere: This sets the current chart displayed to be a chart sphere, which is like a standard chart wheel but in 3D. [This does the same as the -XX switch.]
Show World Map: This sets the current chart displayed to be a simple map of the world displayed in rectangular form. [This does the same as the -XW switch.]
Show Globe: This sets the current display to be the map of the world shown as the side view of a globe. Note that this chart looks nice in animation mode because it rotates! [This does the same as the -XG switch.]
Show Polar Globe: This sets the current display to be the map of the world shown in polar projection with the North (or South) pole in the center. [This does the same as the -XP switch.]
Show Map Effects: This submenu allows one to toggle various settings which control things on the sphere, map, and globe displays. The four commands here are:
Show Constellations: This toggles whether or not the map displays show in them the astronomical constellations instead of the continents of the world. [This does the same as the -XF switch.]
Show Equator: This toggles whether or not the map displays show in them the location of the Earth’s equator. [This does the same as the -Xe switch.]
Show All Stars: This toggles whether or not the map displays show in them every fixed star defined in the sefstars.txt file. [This does the same as the -XU switch.]
Show House Details: This toggles whether or not the map displays show in them the boundaries of the 12 houses. [This does the same as the -XC switch.]
Reverse Background: This toggles whether or not graphics charts are displayed black on a white background as opposed to the standard white on a black background. This setting affects text mode charts in addition to graphics charts, and allows text charts to be displayed on a white background if one prefers. [This does the same as the -Xr switch.]
Monochrome: This toggles whether or not graphics charts are displayed in just black and white monochrome mode as opposed to in the standard selection of 16 VGA colors. [This does the same as the -Xm switch.]
Show Border: This toggles whether or not graphics charts are displayed with borders around them. [This does the same as the -Xu switch.]
Show Chart Info: This toggles whether or not graphics displays have the time and location of the chart in question printed at their base. [This does the same as the -Xt switch.]
Show Info Sidebar: This toggles whether or not wheel charts are displayed with an information sidebar to their right, listing the positions of the houses and objects along with element table summaries. [This does the same as the -v0 switch.]
Show Glyph Labels: This toggles whether or not glyphs are drawn for planets and objects in graphics charts. Pretty much the only time it’s useful to ever turn this off is for the local horizon and orbit charts, especially when doing a timed exposure animation of them. [This does the same as the -Xl switch.]
Square Screen: This resizes both the graphics chart and the window to be square shaped, and is useful for charts such as the wheel or globes if they ever appear oblong and not circular shaped as they should. For wheel charts with sidebars it will logically make it so just the wheel part becomes square.
Character Scale: This submenu allows one to set the size of the glyphs in graphics charts. For text mode charts, this setting will affect the font size of the characters. There are four options on this menu of “Small”, “Medium”, “Large”, and “Huge”, with medium being the default. There are two more options on this menu labeled “Decrease” and “Increase”, which will move the setting down or up a notch (if not already at an extreme). [For graphics these settings correspond to the four percentage values that may be passed to the -Xs switch.] Important note: I've found that some systems, when changing the size of characters for text charts, don't seem to be able to load the correct new font; if you notice characters overlapping each other at small scales and the same size characters with lots of space between them at large scales, opening up a DOS prompt seems to fix the problem.
Globe Tilt: This submenu allows one to change the angle of rotation and tilt of the Earth in the globe charts. The first three menu options here are: “Tilt North”, which pulls the globe down one degree (or rather a number of degrees equal to the animation jump factor); “Tilt South”, which pulls the globe up one degree; and “Set to Zero”, which returns the globe to the standard zero degree angle with the equator edge on. [This affects the same setting as the second optional parameter passed to the -XG switch.] The next two menu options are: “Rotate West”, which rotates the globe to the right one degree (or rather a number of degrees equal to the animation jump factor); and “Rotate East”, which rotates the globe to the left one degree. [This affects the same setting as the first optional parameter to the -XG switch.]
Modify Display: This toggles whether or not each graphics chart is displayed in a slightly modified form, e.g. for the globe display this will plot all the planets at their zenith locations instead of having just the world map itself. [This does the same as the -Xi switch; see the documentation for this switch in an earlier section for a list of how this setting affects each chart.]
Modify Chart: This option acts as a quick way to toggle several settings associated with certain charts. They are:
(1) For wheel charts, toggle between the standard wheel and the
house emphasized wheel.
(2) For the relationship grid, toggle whether it shows midpoints instead of
aspects.
(3) For the local horizon chart, toggle whether it displays with a polar
center.
(4) For the astro-graph chart, toggle whether it draws a line across the world
map at the chart location.
(5) For ephemeris and calendar charts, toggle whether they’re displayed for the
year instead of just the month.
(6) For transit graphs, toggle whether they show all aspects instead of restricting
fast moving objects.
(7) For chart spheres and globe displays, toggle which hemisphere they focus
upon.
(8) For the world map display, toggle whether it’s shown in Mollewide
projection.
Scribble Color: This submenu allows one to select the color to use when using the mouse to draw on the window. It has sixteen options, one for each of the main colors.
Graphics Settings...: This brings up the Graphics Settings dialog, used to set various additional bitmap settings not already covered by menu options. They are:
(1) Two edit controls specifying the horizontal and vertical size of
the graphics chart in pixels [same as -Xw switch].
(2) An edit control specifying the scale size of glyphs in graphics charts,
with a dropdown allowing one to select from the four valid percentages 100
through 400 [same as -Xs switch].
(3) An edit control specifying the scale size of text in graphics charts, with
a dropdown allowing one to select from the four valid percentages 100 through
400 [same as -XS switch].
(4) A checkbox indicating whether charts that look best square should always be
drawn square, even in rectangular windows [same as the -XQ switch].
(5) An edit control specifying the horizontal and vertical number of cells to
have in the graphic aspect grid chart, which may be zero to have the size
automatically determined [same as -YXg switch].
(6) An edit control specifying the rotation in degrees for the globe and world
map charts [same as the first optional parameter passed to the -XG switch].
(7) An edit control specifying the angular tilt in degrees for the globe chart
[same as the second optional parameter passed to the -XG switch].
(8) A checkbox indicating whether to display the world map chart in the oval
shaped Mollewide projection as opposed to just in rectangular form [same as
-XW0 switch].
(9) An edit control specifying the time to delay between doing screen updates
when in animation mode [same as the -WN switch].
(10) A checkbox indicating whether animation mode affects the orientation of
map displays, instead of the time of the chart within the map [same as the -XN
switch].
(11) A checkbox indicating whether the graphics screen doesn't automatically
update after setting changes or window expose events, requiring the user to
manually force redraws [same as the -Wn switch].
(12) A radio button group specifying the “wheel chart rotation”, i.e. whether
to rotate the entire wheel so an object is at the left edge or at the top edge
of the chart, and an edit control specifying which object to use when active
[all this does the same as the -X1 and -X2 switches].
(13) Four radio button pairs allowing one to select between different glyphs to
use for Capricorn, Uranus, Pluto, and Lilith [same as -YXG switch].
(14) A radio button group allowing one to select the decoration for the corners
of wheel charts, along with an edit control for how much of the image to cover
with it [same as the -YXv switch].
Animate menu commands:
Do Animation: This starts animation, which continually updates the static chart. The animation amount will be taken from the values on the Jump Rate and Jump Factor submenus, which by default is to continually “Update To Now”. Selecting this command when animation is already on will toggle it off. [This does the same as the -Xn switch.]
Jump Rate: This submenu allows one to select the type of animation to do, when “Do Animation” is on. The first option, “Update To Now”, sets it so the chart will be continuously updated to the current moment, and will act as a glorified astrological clock. The remaining nine options: “Seconds”, “Minutes”, “Hours”, “Days”, “Months”, “Years”, “Decades”, “Centuries”, and “Millennia”, set it so whatever chart will step forward or backward by the specified amount each update.
Jump Factor: This submenu allows one to select how many units of whatever time rate the animation proceeds by. The nine options here are the numbers one through nine, where for example if animation is jumping by “Minutes” above, selecting “One” will progress the chart by one minute each update, and selecting “Five” will progress by five minutes each update. This setting is ignored when animation is set to “Update To Now” or is off altogether.
Reverse Direction: This option toggles whether or not animation will proceed backwards through time as opposed to forwards. This setting has effect only when animation is on and set to an actual unit, i.e. it’s ignored when set to “Update To Now”.
Pause Animation: This toggles whether or not any animation is paused. Animation being paused is basically the same as animation being off altogether, except that it’s easy to unpause to continue animating. Note that the pause key may be used in addition to the “p” key as a keyboard shortcut to this command.
Timed Exposure: This toggles whether or not the screen is erased between each update. When active, the screen won't be cleared meaning progressive updates are drawn over the existing display. This is generally only useful for charts such as the local horizon or solar system (with glyph labels off) where this effect may be used to create streaks showing the path of objects across the sky or through their orbits. [This does the same as the -Xj switch.]
Step Forward: This moves the time of the current chart forward one day, or rather the number of units set in the “Jump Rate” and “Jump Factor” menus. [This is similar to the -+ switch.]
Step Backward: This moves the time of the current chart backward one day, or rather the number of units set in the “Jump Rate” and “Jump Factor” menus. [This is similar to the -- switch.]
Store Chart Info: This copies the time and location of the current chart being displayed and remembers it in a special buffer. See below.
Recall Chart Info: This sets the current chart information to be that in the special buffer above. [This does the same as using the “-i set” virtual file.]
Help menu commands:
Documentation: This submenu allows one to access and even edit Astrolog’s documentation files online without having to leave the program. The six commands here are:
Open Defaults: This will open the “astrolog.as” default settings file in the Windows Notepad program.
Open Helpfile: This will show the large comprehensive documentation file “astrolog.htm” that you’re reading now, in the default Web browser.
Open Changes: This will open the “changes.htm” file listing the additions to the current version over the previous one, in the default Web browser.
Open License: This command launches the default browser and has it automatically open the Daedalus license file “license.htm”, displaying legal information on how you may use the program. Astrolog uses the GNU General Public License (GPL).
Open Website: This will automatically visit the Astrolog Web site. This command will start the default browser, and have it open the file “astrolog.url” in the Astrolog install directory.
Open Website Mirror: This will open the Astrolog website mirror location at magitech.com in the default browser, as pointed to by the file “astrlog2.url” in the Astrolog install directory.
Setup: Astrolog for Windows can do its own setup in many respects. The five commands on this submenu are:
Program Group (User): This command will create a Windows program group for the current user containing pointers to the Astrolog executable, the main and update documentation files, and the Astrolog website. [This does the same as the -WSg switch.]
Program Group (All): This command will create the same program group, but for all users. [This does the same as the -WSG switch.]
Desktop Icon: This command will create a Windows desktop icon to launch Astrolog. [This does the same as the -WSd switch.]
File Extensions: This command will associate Astrolog with “.as” extension files in the Windows registry. [This does the same as the -WSx switch.]
Uninstall Extensions: This command undoes the effect of the previous command, and unassociates Astrolog from “.as” extension files, which is useful for uninstall. Note the last two menu commands edit the Windows registry, which is protected on Vista and newer versions of Windows, meaning the command may fail and display an error message. Hence Astrolog may need to be run as Administrator in order for the program to have permission to change the registry. [This does the same as the -WSu switch.]
List Signs: This sets the current display to be a text listing of the twelve signs and houses and information about them. [This does the same as the -HC switch.]
List Objects: This sets the current display to be a text listing of all the planets and other objects (that aren't restricted) which Astrolog can compute the positions of, along with information about their rulerships. [This does the same as the -HO switch.]
List Aspects: This sets the current display to be a text listing of all eighteen aspects the program can deal with, and information about them. [This does the same as the -HA switch.]
List Constellations: This sets the current display to be a text listing of all 88 astronomical constellations the program displays in the constellation map charts, and a little information about each one. [This does the same as the -HF switch.]
List Planet Info: This sets the current display to be a text listing of the planets in the solar system, with some astronomical data given about each. [This does the same as the -HS switch.]
List Rays: This sets the current display to be a text listing of the seven Rays, showing their names and associations with signs and planets. [This does the same as the -H7 switch.]
List General Meanings: This sets the current display to be a text listing of the basic interpretation database used by the program, giving the general meanings of each sign, house, planet, and aspect. [This does the same as the -HI switch.]
List Switches: This sets the current display to be a text listing of the main command switches that may be passed to the program, with a one line description of each. [This does the same as the -H switch.]
List Obscure Switches: This sets the current display to be a text listing of the remaining more obscure command switches not covered in the list above. [This does the same as the -Y switch.]
List Keystrokes: This sets the current display to be a text listing of the main shortcut keys (“main” being those that don't require the Alt key and that exist in the DOS version as well) that one may press to do various operations. [This does the same as the -HX switch.]
List Credits: This sets the current display to be a text listing of the credits and copyrights for the program. [This does the same as the -Hc switch.]
About...: This brings up the About Astrolog dialog which contains static text also listing the credits and copyrights for the program. Note that if you compile and run the debug version of the program, the title bar of this dialog will have the text “(DEBUG)” added to it. [This again contains the same text that the -Hc switch display prints.]
Compiling Astrolog is very similar to the process of compiling most other programs: First edit the top of the file astrolog.h, commenting out any of the #define’s which set various features that aren't valid on your system or you don't want, and changing default values and directories to your preference. (Just see the self-explanatory section comments in this file.) Then in the same manner, also edit these default parameter values in the astrolog.as file to your liking, at least the location and time zone values. (I also recommend turning on the Ansi color feature if your system will support it, since text charts look much nicer in color.)
For Unix systems, just run the command 'make' in the directory containing the Makefile. You can also always compile by hand with a command line like: “cc -O -c *.cpp; cc -o astrolog *.o -lm -lX11”. Just make sure to compile each source file and link them together at the end with the math library, and if applicable the X11 library.
It is possible to compile Astrolog on a VMS system, even with its X windows functionality. There’s an example of a simple VMS .COM file in the source code distribution which can automatically compile and link Astrolog on VMS, which should work for the current version, although you might need to include “/noopt” after the CC’s since some compilers may cause the program to pass parameters incorrectly with optimization on.
To compile the Astrolog source code for Windows, the #define WIN compile time flag needs to be uncommented in astrolog.h (this should of course be commented out for all other platforms). In addition, the PC flag should be uncommented, while the flags for other graphics libraries like X11 should be commented out. Pretty much all of the features in the features section should be on, such as INTERPRET, as well as some of the system settings like TIME, because there are menu options that deal with them that won't automatically disappear if they’re disabled. The included file Astrolog.vcproj may be used as a project file or makefile. Ensure “Project / Astrolog Properties / Configuration Properties / Linker / System / Subsystem” is set to “Windows (/SUBSYSTEM:WINDOWS)” so it will be compiled as a Windows program. Also manually add shlwapi.lib to the “Project / Astrolog Properties / Configuration Properties / Linker / Command Line / Additional Options” area, because it may not be automatically detected based on #include files. If you want the C runtime to be statically linked instead of requiring the right runtime DLL to be present, then set “Project / Astrolog Properties / Configuration Properties / C/C++ / Code Generation / Runtime Library” to “Multi-threaded (/MT)” instead of “Multi-threaded DLL (/MD)”. The standard Windows executable was compiled as a 32 bit application using Microsoft Visual Studio 2005. Other Windows compilers should work, provided they have a resource compiler which understands the standard .rc extension resources for menus and dialogs. Astrolog’s source code can compile 64 bit instances of the Windows version too. The Windows About dialog and the -Hc switch display will indicate whether a 32 or 64 bit version of the program is running. Internally, the sources look for the compiler set #define _WIN64 to indicate 64 bit specific content.
To compile a command line only interface (CLI) version of Astrolog on Windows, turn off WIN in astrolog.h before compiling. Also in “Project / Astrolog Properties / Configuration Properties / Linker / System”, set Subsystem to “Console” (instead of “Windows” which starts with the standard Windows GUI).
The command line only version of Astrolog on Windows can also bring up a generic window with the -X switch, when the WCLI #define is uncommented when compiling. This is different from the standard Windows version (which is a full windowed program and not a command line program). The WCLI window won’t have a menu bar, but it will still accept keypresses. It’s basically a Windows version of the X11 and Mac graphics versions, just compiled for Windows instead of those alternate platforms. The WCLI version is more limited, but useful for testing the generic window source code of the program without having to go to different platforms.
--
Astrolog is officially supported and runs on the Mac. The ready to run Mac executable for versions 5.40 and before were distributed in a BinHex 4.0'ed self extracting archive. To unpack it, use a utility that can un-BinHex such files to generate the self extracting archive, and then double click the archive program to unpack the executable, documentation, and other such files. I used CompactPro 1.34 to create the Mac archive, a useful utility that can also BinHex and un-BinHex files. The executable should run on most any 68K processor Mac, and will run on PowerMacs in emulation mode. It requires 750K of heap to run, with 1.5M preferred.
The Mac Astrolog executable has the same icon as the PC version, a ringed planet with tilted red rings and surrounding stars, except the planet body is tan (gray in four bit color mode) instead of yellow. It and the other files are unpacked into their own “Astrolog 5.40” folder, where the folder’s icon has the same ringed planet overlaying it. When the program is actually run, you'll be prompted to enter command switches in a terminal window. There aren't many options available on the Mac menu bar, although you can File Quit and copy selected text to the clipboard with it. The window doesn't have scroll bars for when text runs off the top of the screen, but the -YQ pager will prompt you to press return to continue scrolling if needed, and the -os switch can be used to send all the output to a file in your Astrolog folder. When the program terminates, the window title will prompt you to press return one more time to exit before the window actually goes away.
The program can read from the astrolog.as file, and will use ephemeris files for accurate calculations if -b is in effect. These and chart info files are the same and fully compatible with such files from PC and Unix versions. All files must however be in the Astrolog folder for the program to find them. The -n chart for now switch will work accurately provided the current time and zone are set up correctly in the Control Panels. The -k Ansi text feature does exist in Mac Astrolog, but the terminal won't be able to display the control codes properly, so this isn't really useful unless the output is sent to a file and later displayed in an environment that understands the codes and can show the colored text.
Astrolog’s source code can be compiled and run on the Macintosh perfectly with no special modifications needed. In making the official Mac executable for version 5.40, I used the compiler Symantec C/C++ 7.0 for the Mac. When compiling, uncomment the “MACOLD” compile time option in astrolog.h, turn on the “far data” flag in the compiler, and make sure the ANSI library is set to be loaded. Other Astrolog compile time option settings should be SWITCHES off, ENVIRON off, and PROTO off. For Mac graphics, uncomment the “MACG” compile time setting in astrolog.h, and make sure the MacTraps library is set to be loaded.
The Mac version of Astrolog also supports on-screen graphics, in addition to the ability to create graphic bitmap, metafile, and PostScript files on disk which may be viewed in another program. The -X switch will bring up a separate window with the appropriate wheel or whatever other chart displayed in it, and can press keys while the window is up to change or alter the display. This makes the Mac version more or less equivalent in functionality to the X Windows version, although a few things such as mouse scribbles on the screen and flicker free updates aren't available. In the source code, there’s a compile time option in the astrolog.h file called MACG. When set, it will compile in the Mac screen graphics. When commented out, it will be like before. The MACG define is like the X11 compile time variable which turns on screen graphics for a different platform.
This is a comprehensive history list of the 30 versions of Astrolog that have been released since its beginning. Below is a listing of all versions of Astrolog that have been released, after which for each version, is listed the description of the new features and changes added to that version.
Num Vers. Release Date Features added to version
1 1.00 Wed 11 Sep 91 0:00:38 UTC Initial planet calculations
2 1.10 Sat 14 Sep 91 0:02:16 UTC Aspects, different house systems
3 1.20 Fri 20 Sep 91 23:56:55 UTC File input, wheels, relationships
4 1.30 Wed 9 Oct 91 3:17:04 UTC Transits, searches, astro-graphy
5 1.40 Tue 12 Nov 91 1:18:13 UTC Restrictions, other conveniences
6 2.00 Wed 11 Dec 91 7:11:25 UTC X charts, multiple source files
7 2.10 Tue 18 Feb 92 7:59:03 UTC Color, more X charts, local space, more progression and file support
8 2.20 Wed 3 Jun 92 0:25:40 UTC Stars, space charts, influences, default settings, more relationships
9 2.25 Thu 18 Jun 92 18:54:43 UTC Bug fixes over v2.20
10 2.30 Fri 12 Sep 92 1:20:42 UTC Interpretations, source code comments
11 2.40 Wed 20 Jan 93 3:23:16 UTC Ansi text color, midpoint lists
12 3.00 Sun 21 Mar 93 12:22:27 UTC PC Graphics, more interpretations
13 3.05 Thu 20 May 93 23:40:00 UTC Bug fixes over v3.00
14 3.10 Sun 26 Sep 93 8:29:58 UTC Transit influences, efficiency
15 4.00 Wed 5 Jan 94 10:22:11 UTC Placalc ephemeris, PostScript, metafiles, better wheel charts
16 4.10 Mon 21 Mar 94 10:58:54 UTC Improvements, bug fixes over v4.00
17 4.20 Fri 23 Sep 94 7:19:01 UTC New files, constellations, macros, new objects, dispositors
18 4.30 Mon 28 Nov 94 9:35:33 UTC Parallel aspects, bug fixes
19 4.40 Sun 12 Feb 95 4:28:11 UTC Macintosh support, Arabic parts
20 5.00 Mon 24 Jul 95 10:55:53 UTC Windows interface, asteroid ephemeris
21 5.05 Sun 20 Aug 95 9:29:49 UTC Bug fixes over v5.00
22 5.10 Sun 31 Dec 95 11:56:00 UTC Chart printing, setting saving
23 5.20 Sun 24 Mar 96 14:05:00 UTC Gauquelin sectors, printing fixes
24 5.30 Mon 30 Sep 96 11:55:00 UTC Mac graphics, tri and quad-wheels
25 5.40 Thu 24 Dec 98 14:22:00 UTC Vedic style charts
26 6.00 Mon 22 Dec 15 4:47:57 UTC Swiss Ephemeris planets, esoteric astrology, GNU license
27 6.10 Sun 20 Mar 16 4:30:12 UTC Swiss Ephemeris houses, true and topocentric positions
28 6.20 Mon 20 Mar 17 10:28:39 UTC 3D houses, bug fixes
29 6.30 Mon 23 Oct 17 5:26:42 UTC Chart spheres, transit graphs, Swiss Ephemeris stars
30 6.40 Sun 22 Jul 18 21:00:21 UTC 3D wireframes, 3D orbs, barycentric positions
All of the above versions of Astrolog except 2.25, 3.05, and 5.05 and those after it, were posted in direct source file, shell archive, and/or zip archive form to the Usenet newsgroup alt.astrology. Versions 2.10, 2.25, 3.05 and 4.10 were submitted in shell archive format to comp.sources.misc. In addition, version 1.30 was also posted to talk.religion.newage. Beta releases of versions 5.20 and 6.40 were created but not made generally available. Version 5.40 was released for Windows in both 16 bit and 32 bit architectures. Versions 6.30 and beyond were released for Windows in both 32 bit and 64 bit architectures.
IMPORTANT NOTICE: Astrolog and all chart display routines and anything not enumerated below used in this program are Copyright (C) 1991-2018 by Walter D. Pullen (Astara@msn.com, http://www.astrolog.org/astrolog.htm). Permission is granted to freely use, modify, and distribute these routines provided these credits and notices remain unmodified with any altered or distributed versions of the program.
The main ephemeris databases and calculation routines are from the library SWISS EPHEMERIS and are programmed and copyright 1997-2008 by Astrodienst AG. The use of that source code is subject to the license for the Swiss Ephemeris Free Edition, available at http://www.astro.com/swisseph. This copyright notice must not be changed or removed by any user of this program.
Additional ephemeris databases and formulas are from the calculation routines in the program PLACALC and are programmed and Copyright (C) 1989,1991,1993 by Astrodienst AG and Alois Treindl (alois@astro.ch). The use of that source code is subject to regulations made by Astrodienst Zurich, and the code is not in the public domain. This copyright notice must not be changed or removed by any user of this program.
The original planetary calculation routines used in this program have been copyrighted and the initial core of this program was mostly a conversion to C of the routines created by James Neely as listed in 'Manual of Computer Programming for Astrologers', by Michael Erlewine, available from Matrix Software.
The PostScript code within the core graphics routines are programmed and Copyright (C) 1992-1993 by Brian D. Willoughby (brianw@sounds.wa.com).
More formally: This program is free software; you can redistribute it and/or modify it under the terms of the GNU General Public License as published by the Free Software Foundation; either version 2 of the License, or (at your option) any later version. This program is distributed in the hope that it will be useful and inspiring, but WITHOUT ANY WARRANTY; without even the implied warranty of MERCHANTABILITY or FITNESS FOR A PARTICULAR PURPOSE. See the GNU General Public License for more details, a copy of which is in the LICENSE.HTM file included with Astrolog, and at http://www.gnu.org
O*O*O*O*O*O*O*O*O*O*O*O*O*O*O*O*O*O*O*O*O*O*O*O*O*O*O*O*O*O*O*O*O*O*O*O*O*O
* Walter D. "Cruiser1" Pullen :) ! Astara@msn.com *
O Astrolog 6.40 homepage: http://www.magitech.com/astrolog/astrolog.htm O
* "Who am I, What am I? As I am, I am not. But as we are, I AM. And to *
O you my creation, My Perfect Love is your Perfect Freedom. And I will be O
* with you forever and ever, until the End, and then forever more." - GOD *
O*O*O*O*O*O*O*O*O*O*O*O*O*O*O*O*O*O*O*O*O*O*O*O*O*O*O*O*O*O*O*O*O*O*O*O*O*O
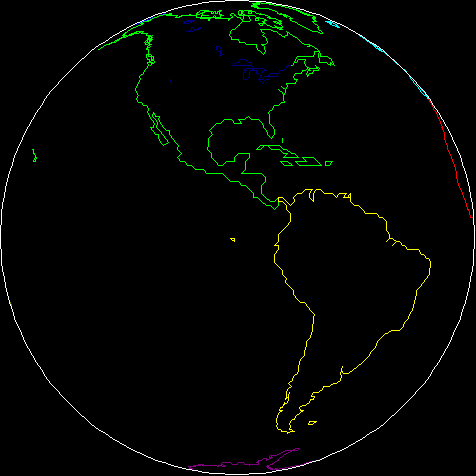